
This story originally appeared on Filterbuy.
While the recent wildfires in Western states have introduced new concerns about air quality, the U.S. has made huge strides in the reduction of air pollution in recent decades.
As a result of the Clean Air Act and modern pollution control technologies, emissions of common air pollutants have dropped by more than 70% since 1970, according to new data from the Environmental Protection Agency.
These reductions, which the EPA claims have significantly improved the environment and human health, occurred despite a growing population, increased energy use and more cars on American roads.
The EPA measures air quality through the Air Quality Index, or AQI. The AQI rates air quality with values between 0 and 500. An AQI over 100 is considered unhealthy for sensitive groups, and anything over 150 is unhealthy for everyone. Major pollutants accounted for by the AQI and regulated by the Clean Air Act include ground-level ozone, particle pollution (or particulate matter), carbon monoxide, sulfur dioxide, nitrogen dioxide and lead.
Components of air pollution pose dangers to the environment and to overall health. Health effects can include reduced oxygen levels; respiratory symptoms; eye, ear and nose irritation; damage to the nervous system; high blood pressure; and heart disease. Those most at risk from air pollution include unborn babies, children, older adults, and people with asthma, heart, and lung disease.
To determine the metropolitan areas with the largest decreases in air pollution over the past decade, researchers at Filterbuy ranked locations by the percentage change in median AQI between the five-year period ending in 2019 and the five-year period ending in 2009. Five-year periods were used to lessen the effects of annual variability in AQI on the overall results.
Here are the large metropolitan areas with the biggest improvement in air quality over the past decade.
15. Atlanta

- 10-year percentage change in median AQI: -20.8%
- Median AQI (2015-2019): 53
- Median AQI (2005-2009): 66
- Number of good AQI days per year (2015-2019): 158
- Number of good AQI days per year (2005-2009): 77
14. Kansas City, Missouri

- 10-year percentage change in median AQI: -21.0%
- Median AQI (2015-2019): 49
- Median AQI (2005-2009): 62
- Number of good AQI days per year (2015-2019): 198
- Number of good AQI days per year (2005-2009): 103
13. New Orleans

- 10-year percentage change in median AQI: -22%
- Median AQI (2015-2019): 46
- Median AQI (2005-2009): 59
- Number of good AQI days per year (2015-2019): 224
- Number of good AQI days per year (2005-2009): 121
12. Indianapolis

- 10-year percentage change in median AQI: -22.3%
- Median AQI (2015-2019): 51
- Median AQI (2005-2009): 65
- Number of good AQI days per year (2015-2019): 178
- Number of good AQI days per year (2005-2009): 81
11. Charlotte, North Carolina

- 10-year percentage change in median AQI: -22.5%
- Median AQI (2015-2019): 47
- Median AQI (2005-2009): 61
- Number of good AQI days per year (2015-2019): 212
- Number of good AQI days per year (2005-2009): 115
10. Virginia Beach, Virginia

- 10-year percentage change in median AQI: -22.9%
- Median AQI (2015-2019): 38
- Median AQI (2005-2009): 50
- Number of good AQI days per year (2015-2019): 310
- Number of good AQI days per year (2005-2009): 187
9. Tampa, Florida
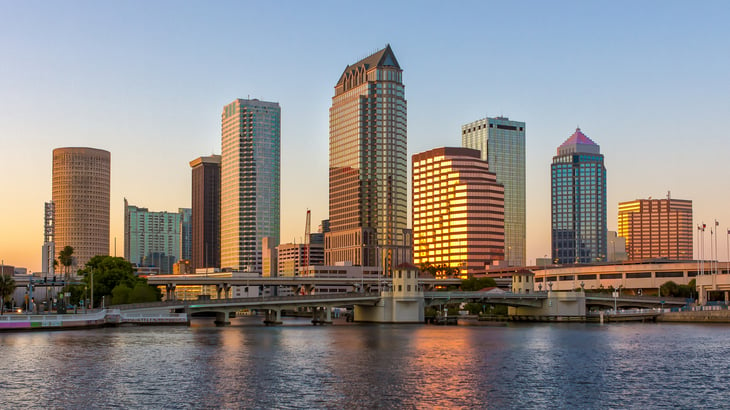
- 10-year percentage change in median AQI: -23.4%
- Median AQI (2015-2019): 44
- Median AQI (2005-2009): 57
- Number of good AQI days per year (2015-2019): 250
- Number of good AQI days per year (2005-2009): 128
8. Chicago

- 10-year percentage change in median AQI: -24.2%
- Median AQI (2015-2019): 55
- Median AQI (2005-2009): 73
- Number of good AQI days per year (2015-2019): 132
- Number of good AQI days per year (2005-2009): 36
7. Memphis, Tennessee
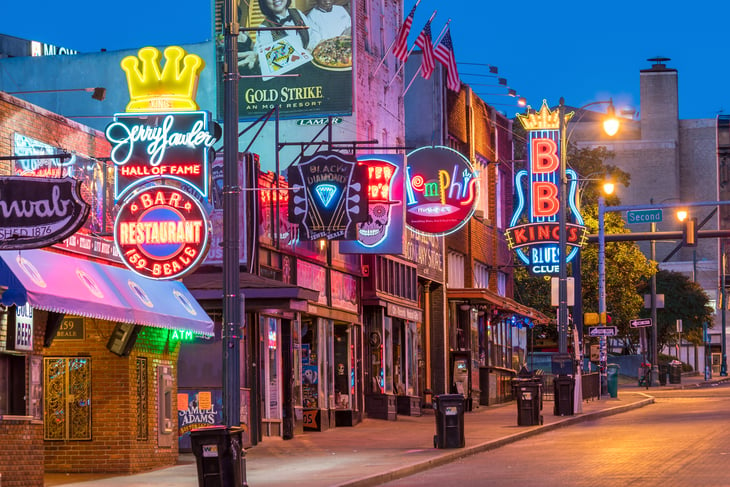
- 10-year percentage change in median AQI: -25.6%
- Median AQI (2015-2019): 44
- Median AQI (2005-2009): 59
- Number of good AQI days per year (2015-2019): 242
- Number of good AQI days per year (2005-2009): 120
6. Cleveland
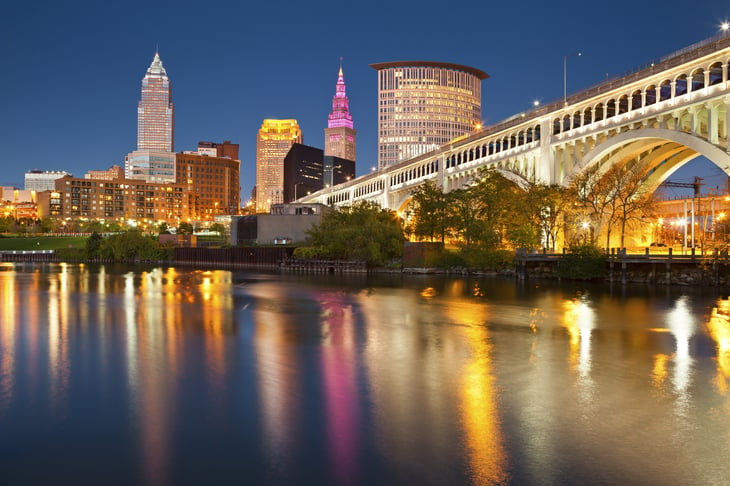
- 10-year percentage change in median AQI: -25.7%
- Median AQI (2015-2019): 50
- Median AQI (2005-2009): 67
- Number of good AQI days per year (2015-2019): 185
- Number of good AQI days per year (2005-2009): 109
5. Phoenix

- 10-year percentage change in median AQI: -26.8%
- Median AQI (2015-2019): 76
- Median AQI (2005-2009): 104
- Number of good AQI days per year (2015-2019): 40
- Number of good AQI days per year (2005-2009): 30
4. Pittsburgh

- 10-year percentage change in median AQI: -26.8%
- Median AQI (2015-2019): 57
- Median AQI (2005-2009): 78
- Number of good AQI days per year (2015-2019): 119
- Number of good AQI days per year (2005-2009): 39
3. Birmingham, Alabama

- 10-year percentage change in median AQI: -27.2%
- Median AQI (2015-2019): 51
- Median AQI (2005-2009): 71
- Number of good AQI days per year (2015-2019): 169
- Number of good AQI days per year (2005-2009): 54
2. Louisville, Kentucky

- 10-year percentage change in median AQI: -27.4%
- Median AQI (2015-2019): 49
- Median AQI (2005-2009): 67
- Number of good AQI days per year (2015-2019): 198
- Number of good AQI days per year (2005-2009): 75
1. St. Louis

- 10-year percentage change in median AQI: -36.5%
- Median AQI (2015-2019): 53
- Median AQI (2005-2009): 84
- Number of good AQI days per year (2015-2019): 154
- Number of good AQI days per year (2005-2009): 36


Add a Comment
Our Policy: We welcome relevant and respectful comments in order to foster healthy and informative discussions. All other comments may be removed. Comments with links are automatically held for moderation.