


Here at MoneyTalksNews, we’re straight with you about the fact you won’t get rich quick. You’ll get rich one day at a time.
However, not everyone understands that. Some people spend a lot of money – we mean, A LOT – trying to get rich quick by playing the lotto. How much? Earlier this year, LendEDU took Census Bureau data for state income from lottery ticket sales in 2015 (the most recent year available) and calculated how much that averages out per resident.
From the frugal folks in the Midwest to the big spenders out East, here’s how much was spent per capita in the 43 states that reported lottery revenue in 2015. Wyoming launched its lotto program in August 2014, but numbers weren’t available for that state.
43. North Dakota: $34.09

The good people of North Dakota aren’t opposed to playing a little lotto now and again, but they certainly aren’t losing their minds over it. Lottery spending breaks down to only $34.09 per resident there. Not surprisingly, the state garners the least amount of revenue from its program as compared to other states.
42. Oklahoma: $43.74

Straight south from North Dakota is the second most frugal state in the nation, at least when it comes to lottery ticket sales. While the Oklahoma program brings in $171.6 million to state coffers, that works out to only $43.74 per resident.
41. Montana: $53.19

Montana residents are trying their luck in the lottery to the tune of $53.19 per resident. The state brings in the second-lowest amount of revenue from its lottery, $55.5 million in 2015.
40. New Mexico: $65.84

In New Mexico, total lottery revenues in 2015 broke down to $65.84 per resident. Overall, the state brought in $137 million from its program during that year, the fourth lowest amount among 43 states.
39. Nebraska: $78.52

With per capita spending that is more than double the most frugal state on the list, Nebraska lottery revenues work out to $78.52 per person.
38. Kansas: $79.55

Kansas lottery spending is only slightly higher, breaking down to $79.55 per person.
37. Colorado: $89.92

The 5.5 million residents of Colorado bought enough lottery tickets in 2015 that it equals out to $89.92 per person.
36. Washington: $90.40
With lottery revenues of $658.9 million, per capita spending in Washington State equals $90.40.
35. Louisiana: $91.25

In Louisiana, people can play Mega Millions, Powerball, scratch offs and more. The total revenues for these games equaled $91.25 per person in 2015.
34. Minnesota: $93.12
Minnesota lottery spending comes out to $93.12 per person. You could have bought a new pair of winter boots with that money.
33. Wisconsin: $99.44

Next door in Wisconsin, lottery sales averaged $99.44 per person. Did we mention the winter boots?
32. Arizona: $100.85
Arizona has the distinction of being the first state where per capita spending breaks $100. In 2015, state lottery revenues equaled $100.85 per person.
31. Iowa: $103.60

The Iowa Lottery says “Woo Hoo for You.” as its tagline, but it’s really woo hoo for them. Lottery revenues brought the state $324.8 million in revenue – or $103.60 per person — for 2015.
30. Idaho: $115.16
When it comes to the lotto, Idaho residents purchased tickets to the tune of $115.16 per person.
29. Arkansas: $128.97

Meanwhile, in Arkansas, per capita lottery revenues were $128.97.
28. California: $140.76
California is only 28th on the list when it comes to per capita spending. Residents purchased enough lottery tickets there to equal out to $140.76 per person. However, the state is second when it comes to overall lottery revenue. California sold $5.5 billion worth of lotto tickets in 2015.
27. Indiana: $146.32

Hooiser Lottery offers 11 different games in which residents can lose, er spend, their money. People were happy to oblige to the tune of $146.32 per person.
26. Texas: $153.65

Bringing in $4.3 billion of revenue in 2015, the Texas lottery program is the fourth largest in the country. Per capita spending was $153.65.
25. Vermont: $167.89
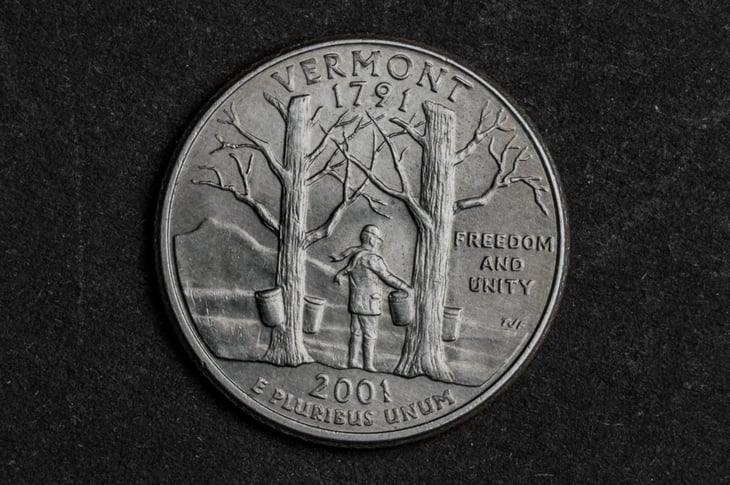
Despite the fact that Vermont’s per capita spending of $167.89 is in the middle of the pack, its lottery program brings in relatively little for the state. At $105 million, it has the third lowest yearly lottery revenue in the nation.
24. South Dakota: $170.93

South Dakota lottery revenues equal out to $170.93 per person. Although it takes the 20th spot for per capita spending, it ranks as fifth lowest when it comes to overall revenue. Its lottery program brought in a relatively meager $148 million in 2015.
23. Maine: $177.38

Over in the northeastern corner of the country, Maine residents spent $177.38 per capita on the lottery.
22. North Carolina: $180.79
At barely a decade old, the North Carolina Education Lottery sold $1.8 billion worth of tickets, or $180.79 per person, in 2015.
21. Missouri: $181.69

Missouri spending on lottery tickets equals out to $181.69 per person.
20. Kentucky: $187.31
In Kentucky, the state brought in $831 million in 2015 according to Census Bureau data. That averaged out to $187.31 per capita.
19. Virginia: $206.85

Virginia is for lovers – including lovers of the lottery, apparently. State residents shelled out enough for tickets to average $206.85 each.
18. Tennessee: $207.33

Nearby, the Tennessee lottery program was dropping $1.4 billion into state coffers, for a per capita average of $207.33 in 2015.
17. New Hampshire: $210.62

New Hampshire has the second-oldest lottery in the country. In 2015, residents spent enough on its games to average $210.62 per person.
16. Oregon: $220.28

At $220.28, Oregon ranks 16th when it comes to per capita spending on the lottery.
15. Illinois: $221.68

The Illinois Lottery promises “anything’s possible.” People must believe that’s true since they spent $2.8 billion on lottery tickets in 2015. That breaks down to $221.68 per person.
14. Ohio: $233.57

With $233.57, you could probably buy a big screen TV on Black Friday. Or you could blow it on lottery tickets. That’s how much people in Ohio spent per capita in 2015.
13. Michigan: $254.40
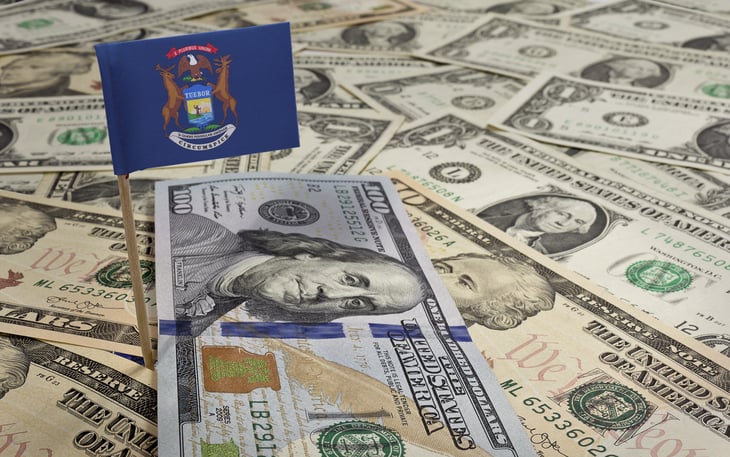
Michigan’s lottery brought in $2.5 billion in revenue in 2015. That’s enough for $254.40 worth of scratch-offs for every man, woman and child.
12. Florida: $256.05
When it comes to revenue from its lottery program, Florida ranks third in the nation. It brought in $5.3 billion for a per capita spending of $256.05.
11. South Carolina: $262.61

South Carolina residents bought enough tickets to average out to $262.61 per person.
10. Pennsylvania: $277.42
Pennsylvania residents are also big spenders. They gave the state $3.5 billion of their money for tickets in 2015. That amount breaks down to $277.42 per resident.
9. Connecticut: $301.89

Connecticut breaks the $300 threshold with per capita lottery sales of $301.89.
8. New Jersey: $316.52

In this eastern state, residents can try for Cash4Life, Mega Millions or Jersey Cash, among other games. New Jersey residents spent enough trying their luck to equal $316.52 per person.
7. Maryland: $354.28
Maryland residents would be happy as clams to win big in the lotto. We’re not sure if they’re having much luck, but they certainly are trying hard. Per capita lottery spending was $354.28 in 2015.
6. Georgia: $356.34

Down south, they are spending only slightly more. Georgia lottery ticket sales break down to $356.34 per person.
5. West Virginia: $359.78

Meanwhile, West Virginians bought $658.8 million worth of lottery tickets in 2015, an amount equal to $359.78 per person.
4. New York: $398.77
The grand champion of lottery sales is New York. The state brought in a whopping $7.8 billion in lotto revenue in 2015. That makes it number one for revenue in the county although it still gets beat out by a few of its neighbors when it comes to per capita spending.
3. Delaware: $420.82

Delaware doesn’t even break 1 million residents, but people are definitely doing their part for the state’s lottery program. Their spending in 2015 equals out to $420.82 per person.
2. Rhode Island: $513.75

Itty bitty Rhode Island stands head and shoulders above other states when it comes to lottery sales. It’s per capita spending was $513.75 in 2015.
1. Massachusetts: $734.85

Massachusetts makes it look like amateur hour in the rest of the country when it comes to the lottery. It isn’t just the top state for per capita spending; it’s the top state by a landslide. It brings in $5 billion in revenue, for a per capita amount of $734.85. With that money, you could buy an iPhone 8, a cross country plane ticket or a month of family health insurance.
We just have one question, Massachusetts: why?
Have you spent money on and/or won money from the lottery? Share with us in comments below or on our Facebook page.
Add a Comment
Our Policy: We welcome relevant and respectful comments in order to foster healthy and informative discussions. All other comments may be removed. Comments with links are automatically held for moderation.