
Editor's Note: This story originally appeared on Roofstock.
Between 2019 and 2020, nearly 29 million Americans moved to new residences within the U.S., nearly 40% of whom moved to different counties or states.
Rising costs of living in some cities are driving residents to more affordable locales. According to the U.S. Census Bureau, while the total U.S. population grew by 1.3% over the past three years, some places with below-average living costs grew by more than 10%.
Geographic mobility within the U.S. has been declining since 2012. Between 1984 and 1985, over 20% of Americans moved residences. By 2020, that figure had dropped to less than 10%. Moving of all kinds — within the same county, to a different county within the same state, and to another state — is trending downwards.
Reasons for this decline include an aging population, high housing and moving costs, and the rise of dual-earner households, according to the Joint Center for Housing Studies of Harvard University. The COVID-19 pandemic temporarily halted many moves, but the trends towards remote work may spur more residents to change locations, particularly to more affordable areas.
To find the affordable metros with the most population growth in recent years, our team of researchers analyzed the latest population data from the U.S. Census Bureau and the latest cost-of-living data from the U.S. Bureau of Economic Analysis. Our methodology is at the end.
Here are the nation’s affordable large metros with the most population growth.
15. Salt Lake City, UT
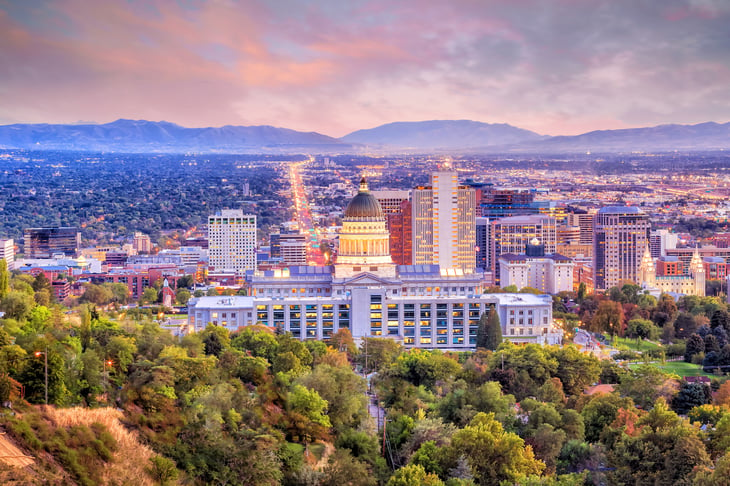
- Percentage change in population (2017-2020): 2.9%
- Total change in population (2017-2020): 35,266
- Population 2020: 1,240,029
- Cost of living (compared with average): -1.4%
14. Indianapolis-Carmel-Anderson, IN

- Percentage change in population (2017-2020): 3.1%
- Total change in population (2017-2020): 62,046
- Population 2020: 2,091,019
- Cost of living (compared with average): -8.9%
13. Oklahoma City, OK

- Percentage change in population (2017-2020): 3.1%
- Total change in population (2017-2020): 43,478
- Population 2020: 1,425,375
- Cost of living (compared with average): -10.2%
12. Tucson, AZ
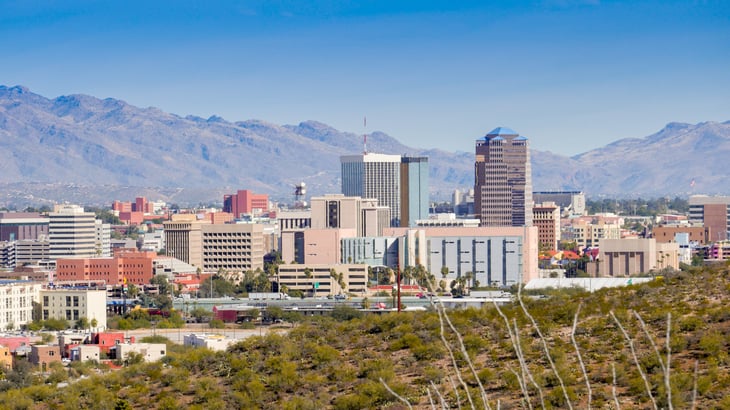
- Percentage change in population (2017-2020): 3.3%
- Total change in population (2017-2020): 34,060
- Population 2020: 1,061,175
- Cost of living (compared with average): -6.9%
11. Atlanta-Sandy Springs-Alpharetta, GA
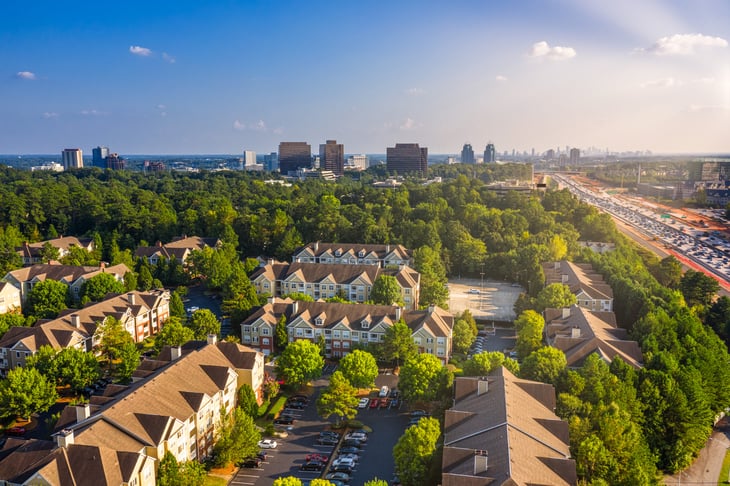
- Percentage change in population (2017-2020): 3.6%
- Total change in population (2017-2020): 210,999
- Population 2020: 6,087,762
- Cost of living (compared with average): -2.1%
10. Tampa-St. Petersburg-Clearwater, FL
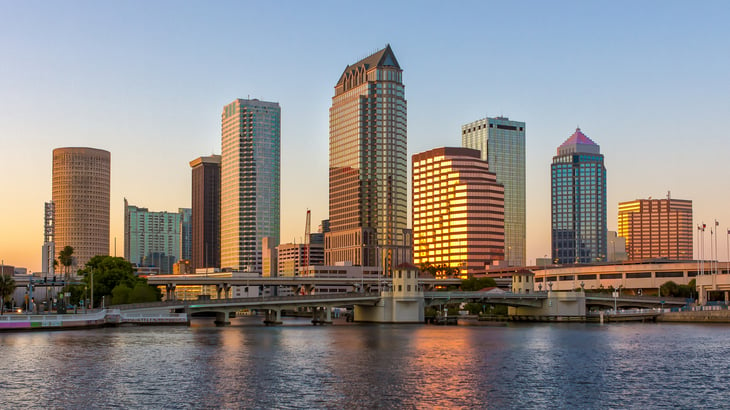
- Percentage change in population (2017-2020): 4.3%
- Total change in population (2017-2020): 133,685
- Population 2020: 3,243,963
- Cost of living (compared with average): -1.2%
9. Nashville-Davidson–Murfreesboro–Franklin, TN

- Percentage change in population (2017-2020): 4.5%
- Total change in population (2017-2020): 84,783
- Population 2020: 1,961,232
- Cost of living (compared with average): -5.6%
8. Orlando-Kissimmee-Sanford, FL
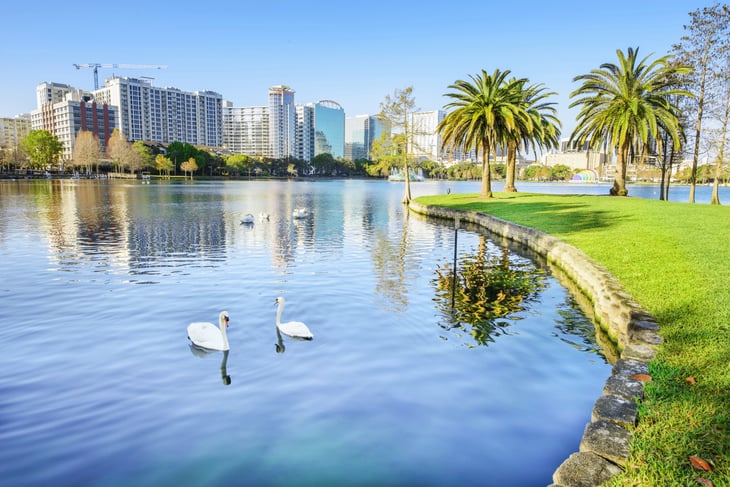
- Percentage change in population (2017-2020): 4.7%
- Total change in population (2017-2020): 119,448
- Population 2020: 2,639,374
- Cost of living (compared with average): -1.0%
7. San Antonio-New Braunfels, TX

- Percentage change in population (2017-2020): 4.8%
- Total change in population (2017-2020): 119,129
- Population 2020: 2,590,732
- Cost of living (compared with average): -6.7%
6. Charlotte-Concord-Gastonia, NC-SC
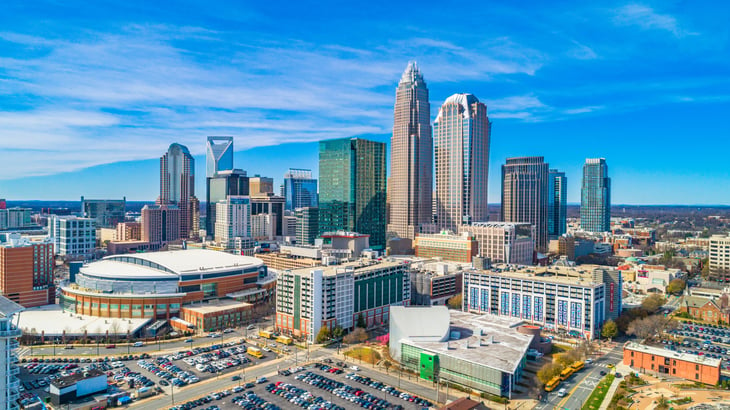
- Percentage change in population (2017-2020): 5.2%
- Total change in population (2017-2020): 131,575
- Population 2020: 2,684,276
- Cost of living (compared with average): -5.6%
5. Jacksonville, FL

- Percentage change in population (2017-2020): 5.4%
- Total change in population (2017-2020): 80,998
- Population 2020: 1,587,892
- Cost of living (compared with average): -4.6%
4. Las Vegas-Henderson-Paradise, NV

- Percentage change in population (2017-2020): 6.1%
- Total change in population (2017-2020): 132,690
- Population 2020: 2,315,963
- Cost of living (compared with average): -3.1%
3. Phoenix-Mesa-Chandler, AZ
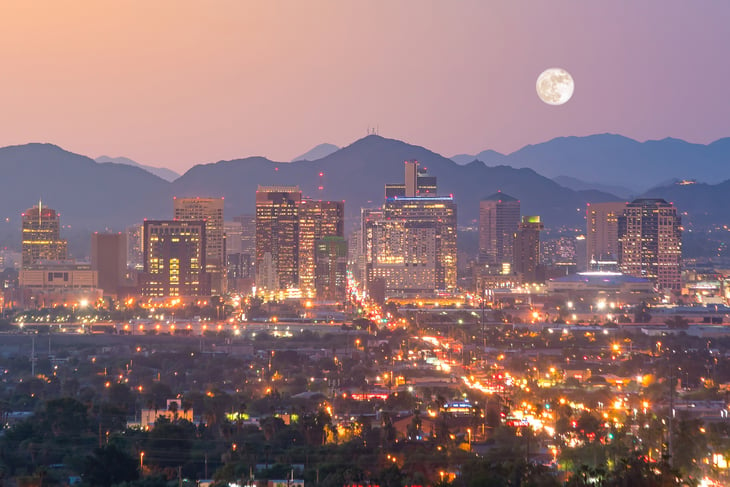
- Percentage change in population (2017-2020): 6.3%
- Total change in population (2017-2020): 299,192
- Population 2020: 5,059,909
- Cost of living (compared with average): -1.3%
2. Raleigh-Cary, NC
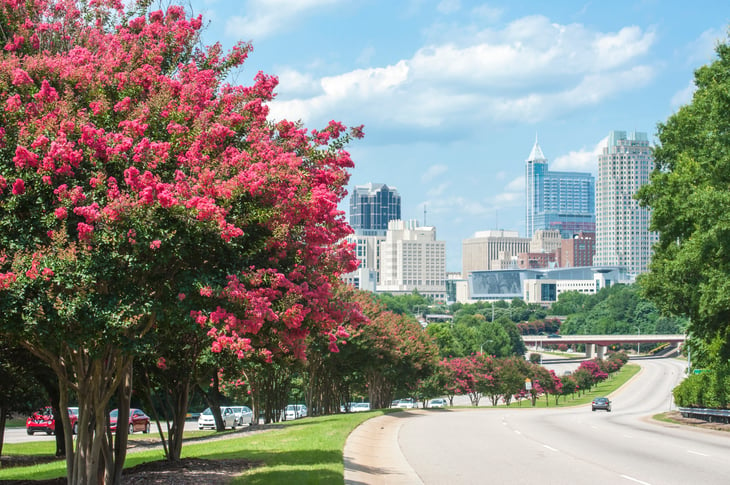
- Percentage change in population (2017-2020): 6.4%
- Total change in population (2017-2020): 85,197
- Population 2020: 1,420,376
- Cost of living (compared with average): -3.9%
1. Austin-Round Rock-Georgetown, TX

- Percentage change in population (2017-2020): 8.5%
- Total change in population (2017-2020): 179,304
- Population 2020: 2,295,303
- Cost of living (compared with average): -0.7%
Methodology

To find the affordable locations with the most population growth, researchers at Roofstock analyzed the latest population data from the U.S. Census Bureau’s Population Estimates Program and cost-of-living data from the U.S. Bureau of Economic Analysis’s Regional Price Parity data.
The researchers ranked metro areas according to the percentage change in population from 2017 to 2020. In the event of a tie, the metro with the larger total change in population from 2017 to 2020 was ranked higher. Only metros with costs of living less than the national average were included in the analysis.
To improve relevance, only metropolitan areas with at least 100,000 people were included.


Add a Comment
Our Policy: We welcome relevant and respectful comments in order to foster healthy and informative discussions. All other comments may be removed. Comments with links are automatically held for moderation.