


This story originally appeared on Roofstock.
COVID-19 has brought tremendous volatility to many economic sectors, and one area where the effects have been felt most strongly is real estate.
In most areas, the onset of the pandemic last spring temporarily brought the real estate market to a standstill. Economic uncertainty was high as businesses shut down, making both buyers and sellers hesitant to enter the market, while stay-at-home orders and health and safety fears made it harder to arrange showings, inspections, and in-person meetings during the closing process.
As time has gone on, however, demand in the real estate market has picked up in a dramatic way. With the transition to working and schooling from home, families are increasingly seeking out homes with more space and amenities. Moreover, government efforts to stimulate the economy have kept interest rates low and provided relief to households through expanded unemployment benefits and direct payments. Simultaneously, shifts in consumer behavior have pushed savings rates higher over the last year. This combination of factors has given more buyers the desire and the means to look for homes.
West Coast and Southwest homes are selling the fastest

And as with all real estate, location matters. Demand—and with it, the speed of sales—are especially high in Western and Southwestern states that have been experiencing the highest rates of population growth. This includes the three states where homes are selling the fastest: Washington, Nevada, and Arizona.
Many of the metros where homes are selling fastest show similar patterns, but there is additional nuance at the local level. Among small and midsize metros where homes are moving off the market quickly, many are just outside of larger metros with high demand, like Logan, Utah near Salt Lake City or Vallejo, California near San Francisco. This may be an indication that more workers are choosing rural and suburban locales where they can commute or work remotely while enjoying a lower cost of living. But among the major metros, COVID-19 has appeared to exacerbate existing trends in hot markets, meaning higher demand, lower supply, and faster time to sell.
To find the locations where homes are selling the fastest, our researchers used Realtor.com data to calculate the median number of days property listings in each metro were on the market, from the initial listing to the closing date. For comparison, the researchers also examined the year-over-year change and the change in median list price.
Keep reading to see the large metros where homes are selling the fastest.
15. Las Vegas-Henderson-Paradise, NV
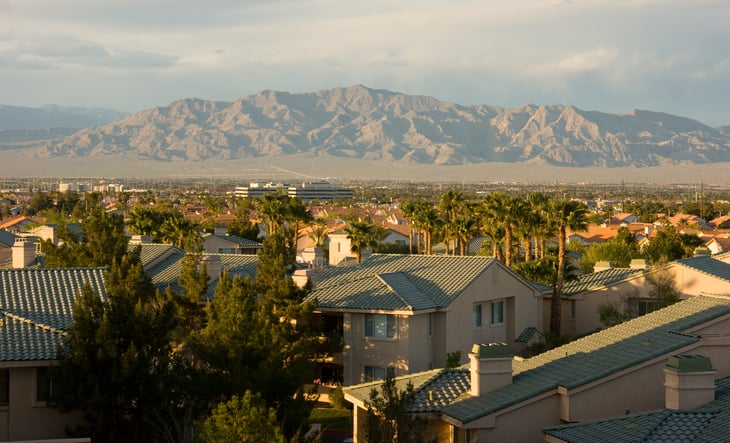
- Median days on the market: 47
- Change in median days on the market (YoY): -3.3%
- Median list price: $336,525
- Change in median list price (YoY): +5.6%
- Median household income: $62,107
- Population: 2,266,715
14. Louisville/Jefferson County, KY-IN

- Median days on the market: 47
- Change in median days on the market (YoY): -8.4%
- Median list price: $267,311
- Change in median list price (YoY): +0.7%
- Median household income: $61,172
- Population: 1,266,389

13. Phoenix-Mesa-Chandler, AZ

- Median days on the market: 45
- Change in median days on the market (YoY): -10.7%
- Median list price: $403,842
- Change in median list price (YoY): +7.8%
- Median household income: $67,896
- Population: 4,948,203
12. Columbus, OH

- Median days on the market: 44
- Change in median days on the market (YoY): -9.3%
- Median list price: $310,359
- Change in median list price (YoY): +8.9%
- Median household income: $67,207
- Population: 2,122,271
11. Minneapolis-St. Paul-Bloomington, MN-WI

- Median days on the market: 43
- Change in median days on the market (YoY): -6.9%
- Median list price: $362,035
- Change in median list price (YoY): +1.2%
- Median household income: $83,698
- Population: 3,640,043
10. San Diego-Chula Vista-Carlsbad, CA

- Median days on the market: 40
- Change in median days on the market (YoY): +1.8%
- Median list price: $767,596
- Change in median list price (YoY): +8.7%
- Median household income: $83,985
- Population: 3,338,330
9. Denver-Aurora-Lakewood, CO

- Median days on the market: 40
- Change in median days on the market (YoY): -1.4%
- Median list price: $539,343
- Change in median list price (YoY): +6.8%
- Median household income: $85,641
- Population: 2,967,239
8. Rochester, NY

- Median days on the market: 40
- Change in median days on the market (YoY): -9.1%
- Median list price: $237,036
- Change in median list price (YoY): +10.8%
- Median household income: $62,104
- Population: 1,069,644
7. Sacramento-Roseville-Folsom, CA

- Median days on the market: 40
- Change in median days on the market (YoY): -10.6%
- Median list price: $523,192
- Change in median list price (YoY): +7.7%
- Median household income: $76,706
- Population: 2,363,730
6. Seattle-Tacoma-Bellevue, WA

- Median days on the market: 39
- Change in median days on the market (YoY): -7.3%
- Median list price: $617,868
- Change in median list price (YoY): +3.2%
- Median household income: $94,027
- Population: 3,979,845
5. Washington-Arlington-Alexandria, DC-VA-MD-WV

- Median days on the market: 39
- Change in median days on the market (YoY): -12.4%
- Median list price: $507,790
- Change in median list price (YoY): +8.0%
- Median household income: $105,659
- Population: 6,280,697
4. Salt Lake City, UT

- Median days on the market: 37
- Change in median days on the market (YoY): -13.7%
- Median list price: $491,641
- Change in median list price (YoY): +13.5%
- Median household income: $80,196
- Population: 1,232,696
3. San Francisco-Oakland-Berkeley, CA

- Median days on the market: 36
- Change in median days on the market (YoY): +2.4%
- Median list price: $999,365
- Change in median list price (YoY): +9.3%
- Median household income: $114,696
- Population: 4,731,803

2. San Jose-Sunnyvale-Santa Clara, CA
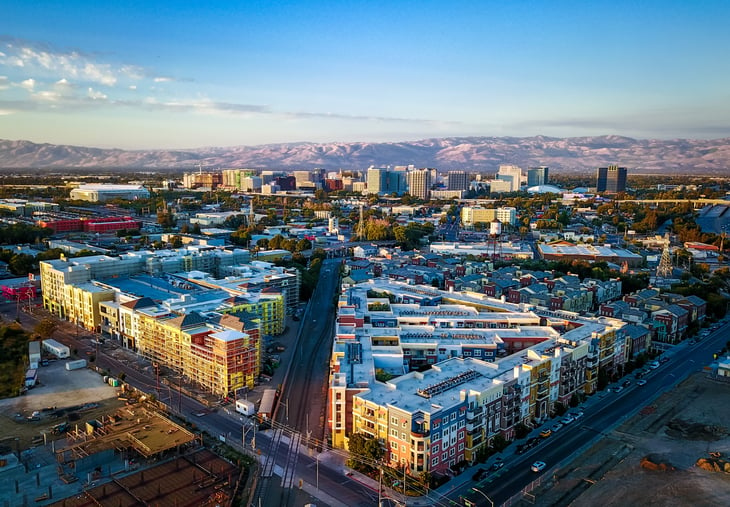
- Median days on the market: 35
- Change in median days on the market (YoY): -7.2%
- Median list price: $1,196,303
- Change in median list price (YoY): +8.0%
- Median household income: $130,865
- Population: 1,990,660
1. Nashville-Davidson–Murfreesboro–Franklin, TN

- Median days on the market: 35
- Change in median days on the market (YoY): -11.4%
- Median list price: $387,495
- Change in median list price (YoY): +5.0%
- Median household income: $70,262
- Population: 1,933,860
Detailed Findings & Methodology

The data used in this analysis is from Realtor.com’s Real Estate Data: Inventory-Monthly and the U.S. Census Bureau’s 2019 American Community Survey. To determine the locations where homes are selling fastest, researchers calculated the median number of days property listings were on the market in 2020. Time spent on the market is defined as the time between the initial listing of a property and either its closing date or the date it is taken off the market. A lower number of days on the market corresponds to homes selling faster.
In the event of a tie, the location with the greatest decrease in median days on the market was ranked higher. All real estate data shown is for 2020, and was calculated by averaging the monthly values for January–December of 2020. Only single-family homes, condos, and townhomes were included in the analysis.
To improve relevance, only metropolitan areas with at least 100,000 residents were included. Additionally, metros were grouped into cohorts based on population size: small (100,000–349,999), midsize (350,000–999,999), and large (1,000,000 or more).
Add a Comment
Our Policy: We welcome relevant and respectful comments in order to foster healthy and informative discussions. All other comments may be removed. Comments with links are automatically held for moderation.