


Editor's Note: This story originally appeared on Forbes Advisor.
Take a deep breath. Picture the air passing through your nostrils and entering your lungs. There might be notes of pine or damp earth or perhaps the salty scent of the ocean. There could be a layer of lingering exhaust fumes from rush hour traffic or a passer-by’s cigarette smoke. Maybe the air is thick with humidity or heavy with a stifling heat.
Air quality is vital to health, yet pollution compromises air quality worldwide. In the U.S. alone, 40% of the population lives in areas with unhealthy air quality, according to the “State of the Air” 2023 report from the American Lung Association. When it comes to air quality and the ability to breathe easy, location matters.
To examine how geographic location affects the air we breathe, Forbes Health collected data across seven distinct metrics — air quality, elevation, population density, vehicle use, smoking prevalence, chronic obstructive pulmonary disease (COPD) prevalence and asthma prevalence — for 250 of the most populated cities in the U.S.
The results paint an intriguing picture of the locations where it’s hardest (and easiest) to breathe. The data also provides some insight into the cities with the highest rates of asthma and COPD, chronic respiratory conditions that may be treated with an oxygen concentrator depending on an individual’s oxygenation levels and unique health care needs.
Many factors can affect how easy or difficult it is to breathe in a specific location. To create a general snapshot of breathability across the most populated cities in the U.S., Forbes Health considered and scored seven specific metrics, prioritizing air quality in particular.
Read on to see the ranking of the top cities where it’s hardest to breathe.
1. Phoenix, Arizona
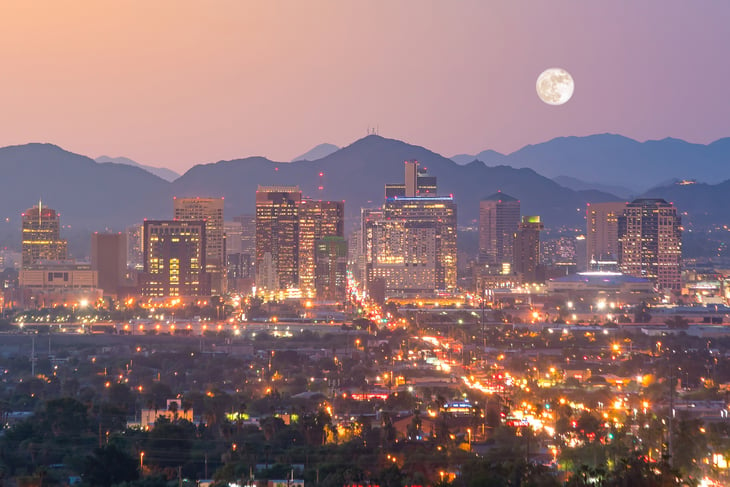
- AQI Rank: 6
- Smoking Rank: 119
- Asthma Rank: 51
- COPD Rank: 113
- Driving Rank: 167
- Density Rank: 10
- Elevation Rank: 54
2. Glendale, California
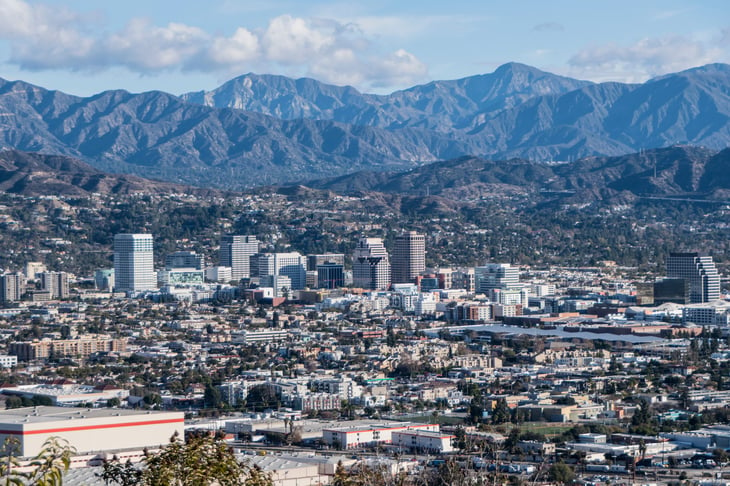
- AQI Rank: 6
- Smoking Rank: 101
- Asthma Rank: 41
- COPD Rank: 97
- Driving Rank: 167
- Density Rank: 101
- Elevation Rank: 42
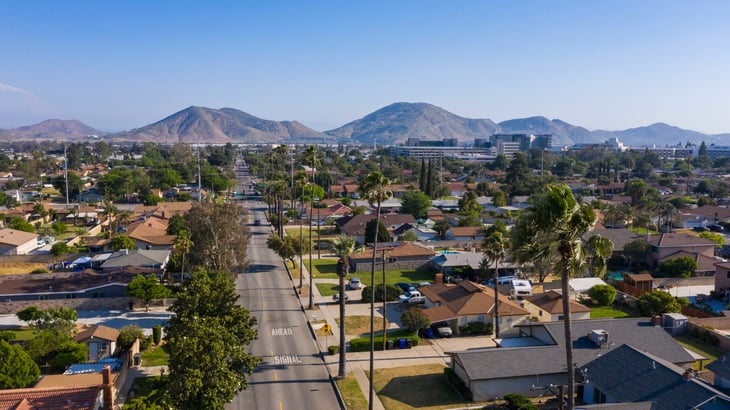
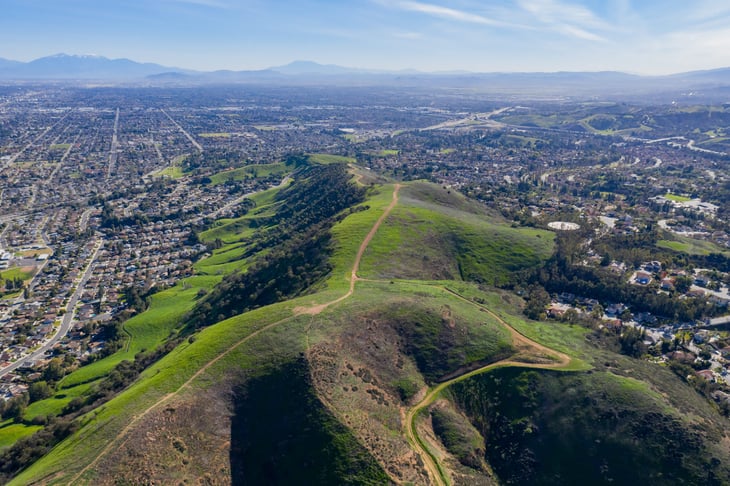
3. San Bernardino, California

- AQI Rank: 53
- Smoking Rank: 97
- Asthma Rank: 94
- COPD Rank: 56
- Driving Rank: 1
- Density Rank: 126
- Elevation Rank: 48

4. Fontana, California
- AQI Rank: 32
- Smoking Rank: 197
- Asthma Rank: 192
- COPD Rank: 177
- Driving Rank: 1
- Density Rank: 69
- Elevation Rank: 37
5. Rochester, Minnesota

- AQI Rank: 21
- Smoking Rank: 24
- Asthma Rank: 242
- COPD Rank: 242
- Driving Rank: 120
- Density Rank: 52
- Elevation Rank: 55
6. Riverside, California
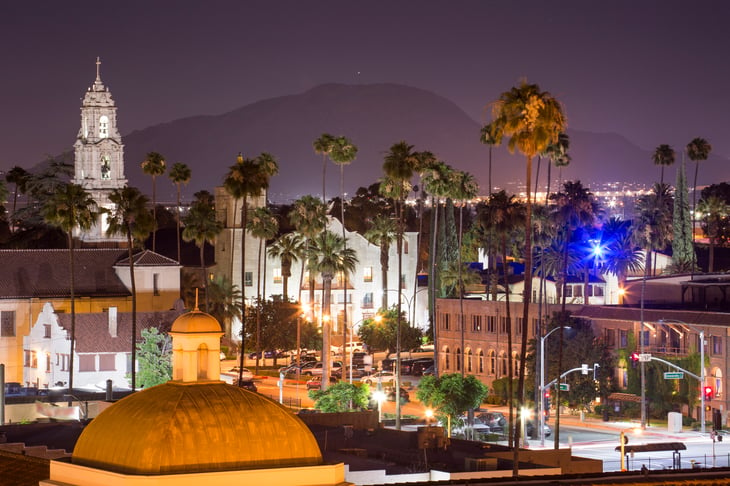
- AQI Rank: 16
- Smoking Rank: 181
- Asthma Rank: 173
- COPD Rank: 158
- Driving Rank: 1
- Density Rank: 111
- Elevation Rank: 75
7. Pasadena, California
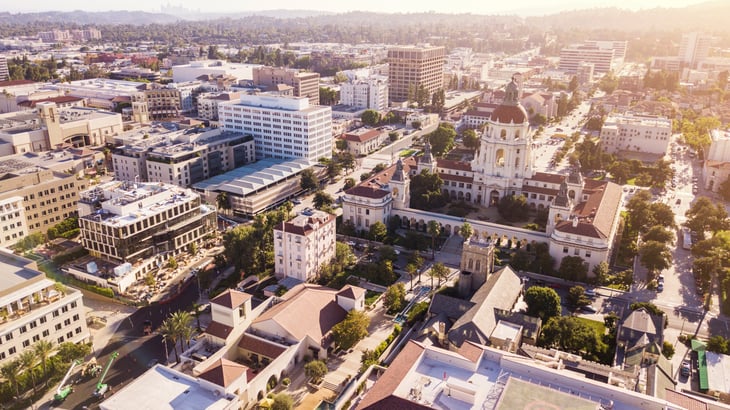
- AQI Rank: 16
- Smoking Rank: 108
- Asthma Rank: 205
- COPD Rank: 113
- Driving Rank: 57
- Density Rank: 130
- Elevation Rank: 65
8. Pomona, California
- AQI Rank: 53
- Smoking Rank: 193
- Asthma Rank: 164
- COPD Rank: 171
- Driving Rank: 1
- Density Rank: 43
- Elevation Rank: 79
9. Ontario, California
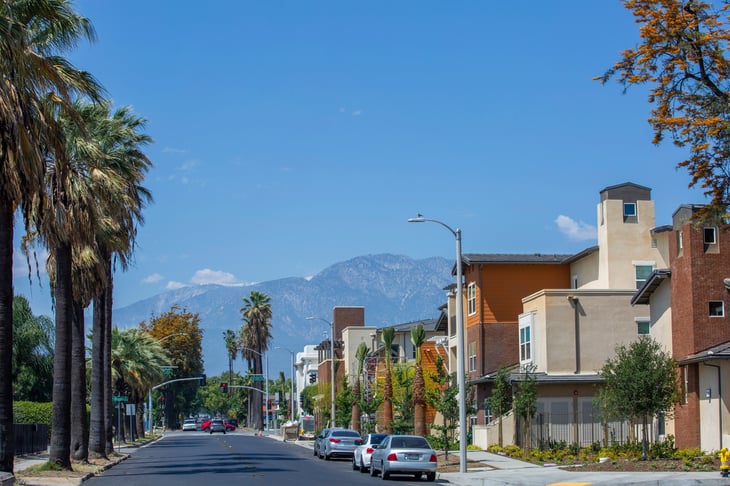
- AQI Rank: 32
- Smoking Rank: 195
- Asthma Rank: 192
- COPD Rank: 165
- Driving Rank: 1
- Density Rank: 129
- Elevation Rank: 59
10. Kansas City, Kansas
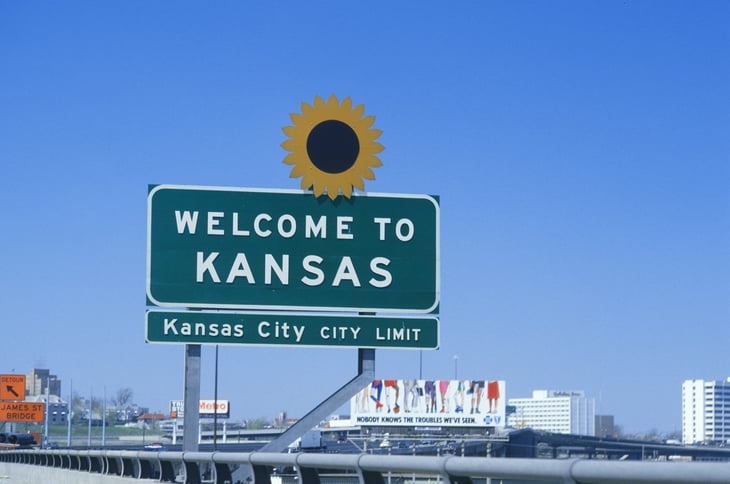
- AQI Rank: 9
- Smoking Rank: 14
- Asthma Rank: 62
- COPD Rank: 56
- Driving Rank: 158
- Density Rank: 225
- Elevation Rank: 66
11. Miami Gardens, Florida
- AQI Rank: 16
- Smoking Rank: 20
- Asthma Rank: 86
- COPD Rank: 21
- Driving Rank: 84
- Density Rank: 47
- Elevation Rank: 232
12. Inglewood, California
- AQI Rank: 49
- Smoking Rank: 172
- Asthma Rank: 47
- COPD Rank: 150
- Driving Rank: 1
- Density Rank: 12
- Elevation Rank: 170
13. Philadelphia, Pennsylvania
- AQI Rank: 57
- Smoking Rank: 13
- Asthma Rank: 14
- COPD Rank: 62
- Driving Rank: 133
- Density Rank: 10
- Elevation Rank: 178
14. Garland, Texas

- AQI Rank: 32
- Smoking Rank: 116
- Asthma Rank: 173
- COPD Rank: 121
- Driving Rank: 57
- Density Rank: 86
- Elevation Rank: 118
15. Peoria, Illinois

- AQI Rank: 6
- Smoking Rank: 64
- Asthma Rank: 62
- COPD Rank: 68
- Driving Rank: 167
- Density Rank: 249
- Elevation Rank: 50
Methodology

To determine how difficult it can be to breathe in various cities in the U.S., Forbes Health collected data on seven metrics for 250 of the largest cities in the U.S., as measured by CDC population counts.
In addition to the largest cities by population, we added data for the most populous city in each state that wasn’t represented in the top 250, which meant adding data for Wilmington, Delaware; Portland, Maine; Billings, Montana; Fargo, North Dakota; Burlington, Vermont; Charleston, West Virginia; and Cheyenne, Wyoming. We then weighted each metric to determine rankings in each category, as well as overall rankings.
Air quality measures came from the EPA and its state-level partners, which provide real-time air quality index (AQI) figures via AirNow.gov. Air quality index figures were collected on March 15, 2023. Cities that did not have AQI measures were removed from our overall list, leaving us with a total of 256 cities.
Data on asthma prevalence, chronic obstructive pulmonary disease (COPD) diagnoses and smoking rates was sourced from the 500 Cities Project, a joint initiative of the CDC, the Robert Wood Johnson Foundation and the CDC Foundation that provides city-level and census tract–level estimates for 27 chronic disease measures. We used the age-adjusted prevalence rate for adults (age 18 and older) for each metric.
Vehicle use statistics came from the U.S. Department of Transportation’s Federal Highway Administration’s data. We used each state’s number of vehicle miles driven and applied it to all cities within that state. Meanwhile, population density was collected for each city from 2020 U.S. Census Bureau figures, and elevation data was sourced from Google Earth.
Add a Comment
Our Policy: We welcome relevant and respectful comments in order to foster healthy and informative discussions. All other comments may be removed. Comments with links are automatically held for moderation.