


Editor's Note: This story originally appeared on Porch.
After a year and a half of the COVID-19 pandemic, many of the policies put in place to protect homeowners and renters are coming to an end, and this fall could see a wave of foreclosures and evictions as a result.
From early on in the pandemic, policymakers enacted measures to protect renters and homeowners from being put out of their homes. The federal government created funds for rent and mortgage assistance, enacted an eviction moratorium to protect renters, and established a foreclosure moratorium and forbearance program for homeowners with federally-backed mortgages. Numerous states and localities followed suit with moratoriums and housing assistance programs of their own, while many private lenders offered mortgage forbearance options in line with the federal policy.
There were strong economic and public health rationales to put all of these measures in place. The loss of a home through eviction or foreclosure can be tremendously disruptive for individual families’ finances, and at scale, widespread turnover can create catastrophic conditions in the larger real estate market, as the last recession proved. And with the pandemic raging through much of 2020 and 2021, it was also important to help people remain in place to minimize the potential spread of the coronavirus.
These interventions have accomplished their desired effects so far, and mortgage delinquency rates provide one illustration. The percentage of mortgages that are at least 90 days delinquent — essentially meaning that the mortgage holder has missed three consecutive payments, usually taken as a sign of severe economic distress — has remained below 1% throughout the pandemic thanks in large part to forbearance. This stands in stark contrast to the Great Recession, when homeowners did not have the same options available and mortgage delinquencies peaked at nearly 9% in 2010.
Now, as these programs wind down, the economic consequences that policymakers hoped to stave off may come to fruition. The foreclosure moratorium expired on July 31, with forbearance options remaining available until Sept. 30. The eviction moratorium was also slated to end on July 31 but was later extended. With many homeowners and renters behind on payments, the end of these programs could present major fallout for housing in the U.S. this year.
Metros With the Most Residents Who Fell Behind on Their Mortgages

According to U.S. Census Bureau data, homeowners in some locations may be more vulnerable than others to foreclosure in the coming months. The Household Pulse Survey includes a measure of how many adults report being behind on their mortgages. At the state level, New York may be most at risk, with an average of 8.9% of homeowners reporting being behind on their mortgage payments throughout the pandemic. Other states with high housing costs, like Hawaii (8.3%), Maryland (8.0%), and New Jersey (7.9%), rank highly, as do many Southern states where household incomes are lower and the economic effects of the pandemic may have been felt more strongly.
At the metro level, similar trends hold, with both high-cost locations, such as New York City, and economically distressed locations, like Detroit, being most likely to have homeowners behind on their mortgage payments.
The data used in this analysis is from the U.S. Census Bureau and the U.S. Bureau of Labor Statistics. To determine the locations that fell behind on their mortgages during COVID-19, researchers at Porch calculated the percentage of adults who reported not being current on their mortgage payments, averaged over all available weeks of the Household Pulse Survey. As such, the data represents the typical number of people who were behind on their mortgages at any given time during the pandemic, rather than the cumulative values. In the event of a tie, the location with the greater average number of adults who were behind on their mortgages was ranked higher.
The following are the metropolitan areas with the most residents who fell behind on their mortgages during COVID-19.
15. Seattle-Tacoma-Bellevue, WA

- Percentage of adults who were behind on their mortgages: 5.5%
- Total adults who were behind on their mortgages: 177,090
- Median monthly owner costs for mortgage holders: $2,359
- Peak unemployment rate in 2020: 16.7%
14. Boston-Cambridge-Newton, MA-NH

- Percentage of adults who were behind on their mortgages: 5.5%
- Total adults who were behind on their mortgages: 207,696
- Median monthly owner costs for mortgage holders: $2,482
- Peak unemployment rate in 2020: 15.6%

13. Phoenix-Mesa-Chandler, AZ

- Percentage of adults who were behind on their mortgages: 5.7%
- Total adults who were behind on their mortgages: 221,193
- Median monthly owner costs for mortgage holders: $1,540
- Peak unemployment rate in 2020: 13.5%
12. Detroit-Warren-Dearborn, MI

- Percentage of adults who were behind on their mortgages: 5.7%
- Total adults who were behind on their mortgages: 200,891
- Median monthly owner costs for mortgage holders: $1,424
- Peak unemployment rate in 2020: 24.7%
11. San Francisco-Oakland-Berkeley, CA

- Percentage of adults who were behind on their mortgages: 6.6%
- Total adults who were behind on their mortgages: 231,438
- Median monthly owner costs for mortgage holders: $3,237
- Peak unemployment rate in 2020: 13.7%
10. Philadelphia-Camden-Wilmington, PA-NJ-DE-MD

- Percentage of adults who were behind on their mortgages: 6.8%
- Total adults who were behind on their mortgages: 337,458
- Median monthly owner costs for mortgage holders: $1,870
- Peak unemployment rate in 2020: 15.0%
9. Dallas-Fort Worth-Arlington, TX

- Percentage of adults who were behind on their mortgages: 6.9%
- Total adults who were behind on their mortgages: 415,481
- Median monthly owner costs for mortgage holders: $1,870
- Peak unemployment rate in 2020: 12.5%
8. Chicago-Naperville-Elgin, IL-IN-WI

- Percentage of adults who were behind on their mortgages: 7.0%
- Total adults who were behind on their mortgages: 496,134
- Median monthly owner costs for mortgage holders: $1,882
- Peak unemployment rate in 2020: 16.5%
7. Riverside-San Bernardino-Ontario, CA
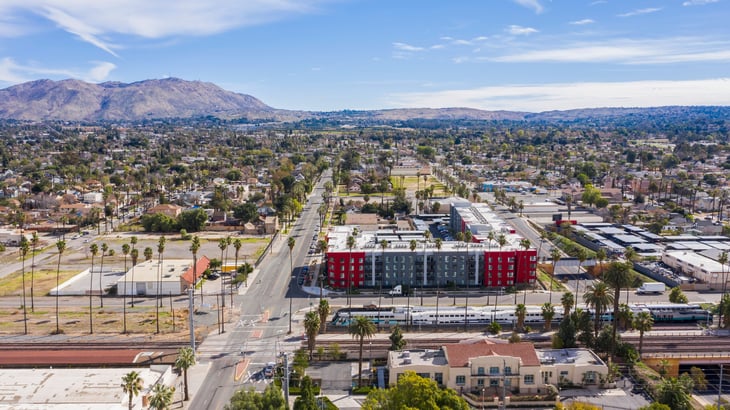
- Percentage of adults who were behind on their mortgages: 7.3%
- Total adults who were behind on their mortgages: 297,130
- Median monthly owner costs for mortgage holders: $1,969
- Peak unemployment rate in 2020: 15.2%
6. Washington-Arlington-Alexandria, DC-VA-MD-WV

- Percentage of adults who were behind on their mortgages: 7.3%
- Total adults who were behind on their mortgages: 335,436
- Median monthly owner costs for mortgage holders: $2,417
- Peak unemployment rate in 2020: 9.4%
5. Atlanta-Sandy Springs-Alpharetta, GA
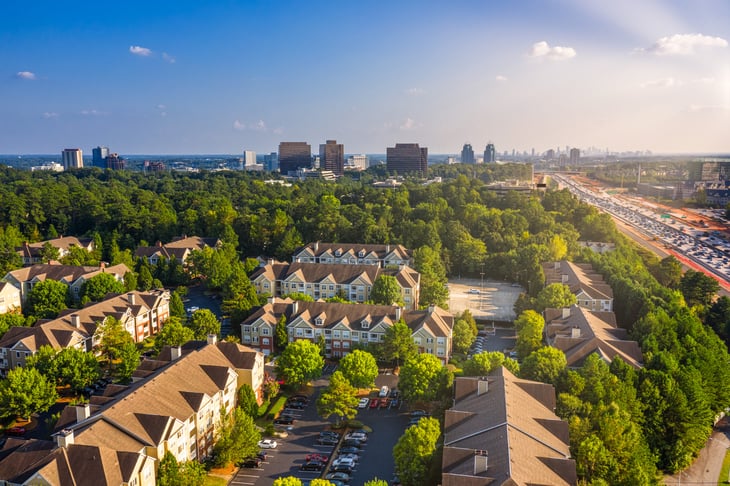
- Percentage of adults who were behind on their mortgages: 8.2%
- Total adults who were behind on their mortgages: 379,004
- Median monthly owner costs for mortgage holders: $1,586
- Peak unemployment rate in 2020: 12.6%
4. Los Angeles-Long Beach-Anaheim, CA

- Percentage of adults who were behind on their mortgages: 8.3%
- Total adults who were behind on their mortgages: 860,103
- Median monthly owner costs for mortgage holders: $2,659
- Peak unemployment rate in 2020: 17.9%
3. Houston-The Woodlands-Sugar Land, TX

- Percentage of adults who were behind on their mortgages: 8.6%
- Total adults who were behind on their mortgages: 470,720
- Median monthly owner costs for mortgage holders: $1,815
- Peak unemployment rate in 2020: 14.0%

2. Miami-Fort Lauderdale-Pompano Beach, FL

- Percentage of adults who were behind on their mortgages: 9.1%
- Total adults who were behind on their mortgages: 438,150
- Median monthly owner costs for mortgage holders: $1,874
- Peak unemployment rate in 2020: 13.8%
1. New York City-Newark-Jersey City, NY-NJ-PA

- Percentage of adults who were behind on their mortgages: 9.9%
- Total adults who were behind on their mortgages: 1,381,177
- Median monthly owner costs for mortgage holders: $2,807
- Peak unemployment rate in 2020: 17.0%
Detailed Findings & Methodology

The data used in this analysis is from the U.S. Census Bureau’s Household Pulse Survey, the U.S. Census Bureau’s American Community Survey 1-Year Estimates, and the U.S. Bureau of Labor Statistics’ Local Area Unemployment Statistics. To determine the locations that fell behind on their mortgages during COVID-19, researchers calculated the percentage and number of adults who reported not being current on their mortgage payment, averaged over all available weeks of the survey — Aug. 19, 2020, through Aug. 2, 2021. As such, the data represents the typical percentage and number of people who were behind on their mortgages at any given time during the pandemic, rather than the cumulative values. In the event of a tie, the location with the greater average number of adults who were behind on their mortgages was ranked higher. Only select major U.S. metros covered by the Household Pulse Survey were included in the analysis.
Add a Comment
Our Policy: We welcome relevant and respectful comments in order to foster healthy and informative discussions. All other comments may be removed. Comments with links are automatically held for moderation.