
Editor's Note: This story originally appeared on Porch.
The COVID-19 pandemic transformed many aspects of American life, from work and the economy to social interactions to entertainment to the state of travel and much more. For consumers, one significant change has been the accelerated adoption of delivery services as a part of commerce.
While delivery options for restaurant meals, groceries, and consumer goods were already available before COVID-19, the pandemic made delivery an indispensable service for more households. Early COVID-19 lockdowns in the spring of 2020 led consumers to rely on socially distanced options for shopping and eating.
But beyond initial necessity, the convenience of delivery services has permanently won over many consumers and become more commonplace as a result. According to the National Restaurant Association, more than half of adults say that takeout or food delivery is essential to the way they live, while in the retail sector, e-commerce as a share of total retail sales globally jumped from 13.6% in 2019 to 18% in 2020.
The Bureau of Labor Statistics projects continued growth in the delivery driver profession over the years ahead. Between Light Truck Drivers, who use light trucks or vans to deliver packages and merchandise, and Driver/Sales Workers, who pick up or deliver food and other goods, the BLS anticipates that there will be an additional 182,900 jobs for delivery drivers between now and 2030. This would be a 12% increase, which is faster than the average for other professions.
One of the major factors affecting delivery driver concentrations at the metro level is whether a location has a significant shipping and logistics industry.
The data used in this analysis is from the U.S. Bureau of Labor Statistics Occupational Employment and Wage Statistics. To determine the locations with the most delivery drivers per capita, researchers at Porch calculated the number of delivery drivers per thousand residents. More information on our methodology is available at the end.
Here are the metropolitan areas with the most delivery drivers per capita.
15. Kansas City, MO-KS
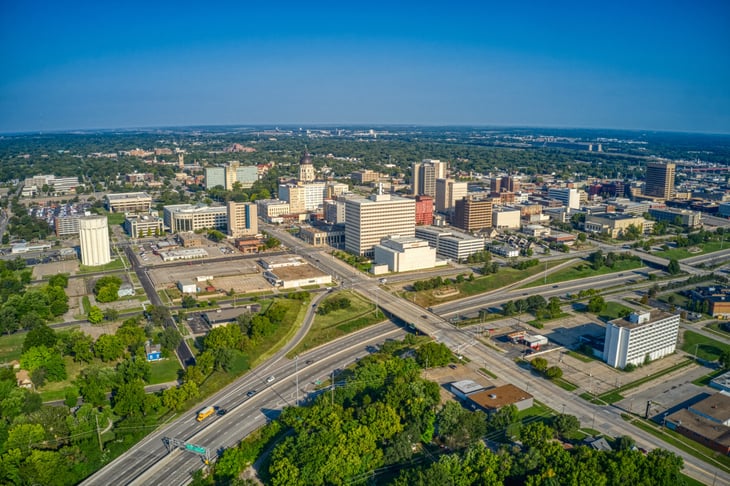
- Number of delivery drivers per thousand: 4.8
- Delivery drivers as a share of total employment: 1.02%
- Total number of delivery drivers: 10,490
- Average hourly wage for delivery drivers: $16.97
14. Atlanta-Sandy Springs-Roswell, GA
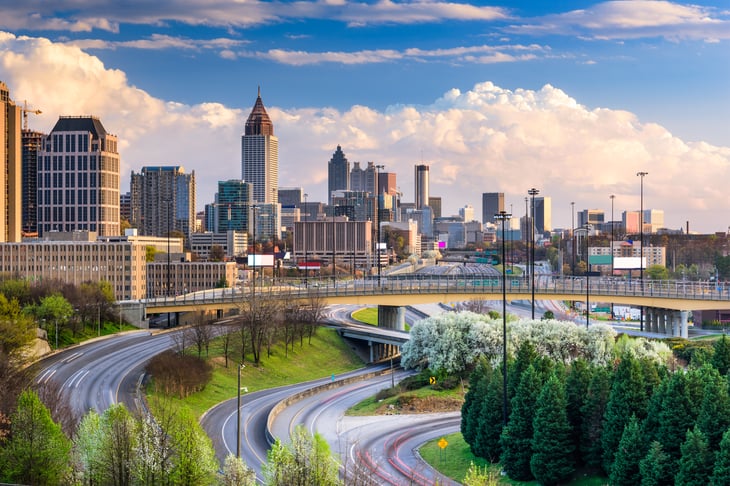
- Number of delivery drivers per thousand: 4.8
- Delivery drivers as a share of total employment: 1.10%
- Total number of delivery drivers: 28,980
- Average hourly wage for delivery drivers: $17.38
13. Milwaukee-Waukesha-West Allis, WI

- Number of delivery drivers per thousand: 4.9
- Delivery drivers as a share of total employment: 0.96%
- Total number of delivery drivers: 7,670
- Average hourly wage for delivery drivers: $16.28
12. Dallas-Fort Worth-Arlington, TX

- Number of delivery drivers per thousand: 5.0
- Delivery drivers as a share of total employment: 1.07%
- Total number of delivery drivers: 38,370
- Average hourly wage for delivery drivers: $19.21
11. Charlotte-Concord-Gastonia, NC-SC

- Number of delivery drivers per thousand: 5.0
- Delivery drivers as a share of total employment: 1.11%
- Total number of delivery drivers: 13,430
- Average hourly wage for delivery drivers: $15.59
10. Oklahoma City, OK

- Number of delivery drivers per thousand: 5.0
- Delivery drivers as a share of total employment: 1.17%
- Total number of delivery drivers: 7,160
- Average hourly wage for delivery drivers: $17.17
9. Nashville – Davidson – Murfreesboro – Franklin, TN

- Number of delivery drivers per thousand: 5.1
- Delivery drivers as a share of total employment: 1.04%
- Total number of delivery drivers: 10,000
- Average hourly wage for delivery drivers: $16.75
8. Raleigh, NC

- Number of delivery drivers per thousand: 5.3
- Delivery drivers as a share of total employment: 1.21%
- Total number of delivery drivers: 7,520
- Average hourly wage for delivery drivers: $14.89
7. Hartford-West Hartford-East Hartford, CT

- Number of delivery drivers per thousand: 5.4
- Delivery drivers as a share of total employment: 1.18%
- Total number of delivery drivers: 6,470
- Average hourly wage for delivery drivers: $18.30
6. Salt Lake City, UT

- Number of delivery drivers per thousand: 5.5
- Delivery drivers as a share of total employment: 0.95%
- Total number of delivery drivers: 6,870
- Average hourly wage for delivery drivers: $19.51
5. Chicago-Naperville-Elgin, IL-IN-WI
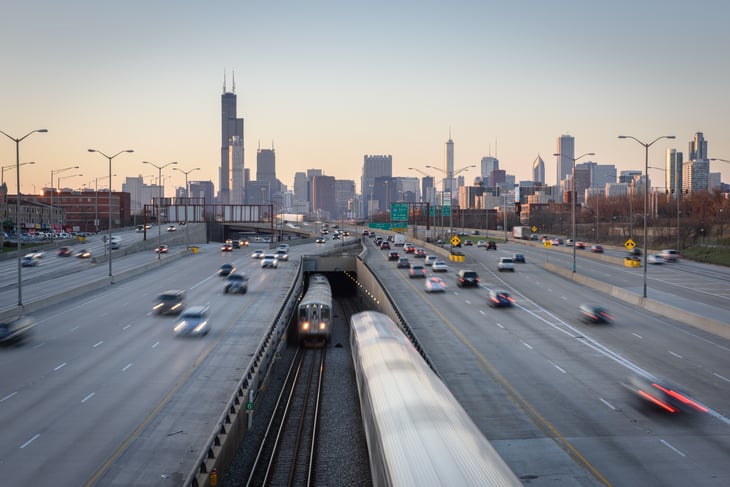
- Number of delivery drivers per thousand: 5.8
- Delivery drivers as a share of total employment: 1.25%
- Total number of delivery drivers: 54,310
- Average hourly wage for delivery drivers: $22.22
4. Columbus, OH

- Number of delivery drivers per thousand: 5.9
- Delivery drivers as a share of total employment: 1.23%
- Total number of delivery drivers: 12,610
- Average hourly wage for delivery drivers: $15.96
3. Cincinnati, OH-KY-IN

- Number of delivery drivers per thousand: 5.9
- Delivery drivers as a share of total employment: 1.27%
- Total number of delivery drivers: 13,110
- Average hourly wage for delivery drivers: $16.44
2. Louisville/Jefferson County, KY-IN

- Number of delivery drivers per thousand: 6.4
- Delivery drivers as a share of total employment: 1.32%
- Total number of delivery drivers: 8,100
- Average hourly wage for delivery drivers: $18.51
1. Memphis, TN-MS-AR

- Number of delivery drivers per thousand: 7.7
- Delivery drivers as a share of total employment: 1.71%
- Total number of delivery drivers: 10,390
- Average hourly wage for delivery drivers: $18.41
Methodology

The data used in this analysis is from the U.S. Bureau of Labor Statistics Occupational Employment and Wage Statistics. To determine the locations with the most delivery drivers per capita, researchers calculated the number of delivery drivers per thousand residents. In the event of a tie, the location with the higher percentage of delivery drivers as a share of total employment was ranked higher. To improve relevance, only metropolitan areas with at least 100,000 residents were included. Additionally, metros were grouped into cohorts based on population size: small (100,000–349,999), midsize (350,000–999,999), and large (1,000,000 or more). Delivery drivers were defined as either Driver/Sales Workers or Light Truck Drivers per the U.S. Bureau of Labor Statistics definitions.


Add a Comment
Our Policy: We welcome relevant and respectful comments in order to foster healthy and informative discussions. All other comments may be removed. Comments with links are automatically held for moderation.