


Editor's Note: This story originally appeared on LawnStarter.
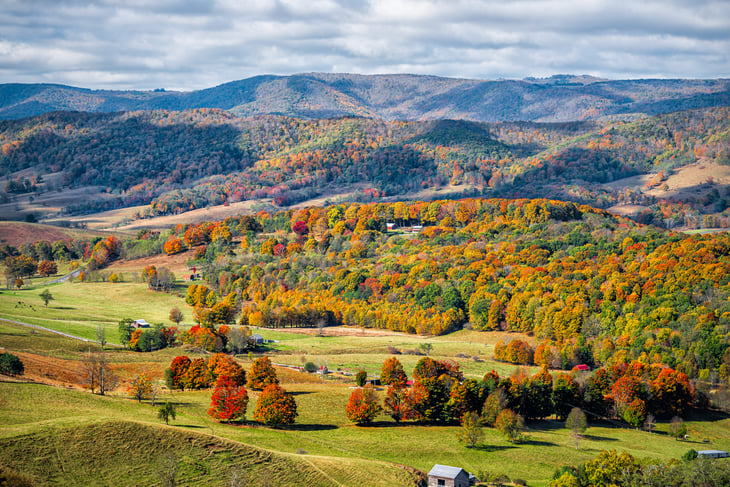
Fall tourism generates billions of dollars in the U.S. annually, but which states offer the best opportunities for seasonal celebrations like picking apples, fall festivals, and leaf-peeping?
LawnStarter ranked the best states for fall festivities.
We considered the 48 contiguous U.S. states based on 24 total metrics, including duration of fall foliage, forest coverage, and fall festivals.
We also considered some traditional fall activities, like apple orchards, corn mazes, and maple farms. Explore our methodology at the end to see the full breakdown of how we ranked the states.
Here are the top states for autumn fun.
15. Wisconsin
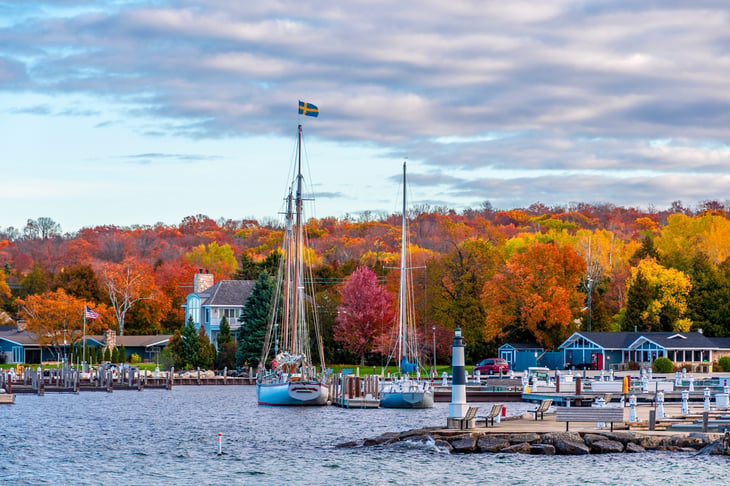
- Overall Score: 38.99
- Duration of Fall Scenery Rank: 27
- Outdoor Recreation Rank: 24
- Entertainment Rank: 3
- Climate Rank: 4
14. Idaho
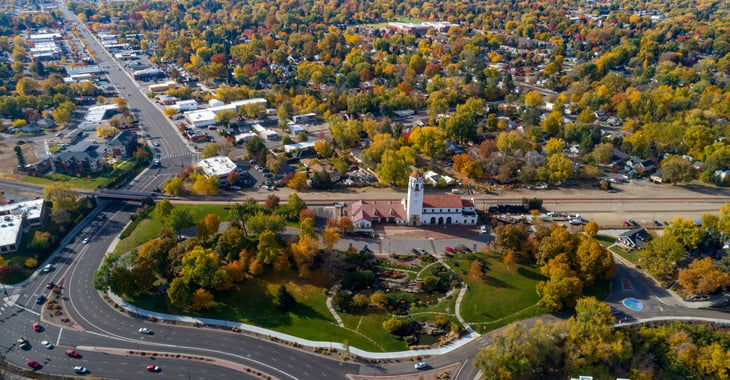
- Overall Score: 40.14
- Duration of Fall Scenery Rank: 12
- Outdoor Recreation Rank: 27
- Entertainment Rank: 23
- Climate Rank: 7
13. New Hampshire
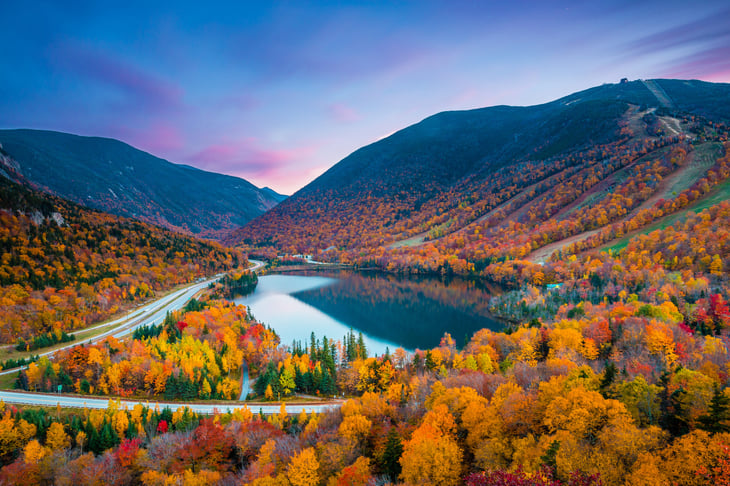
- Overall Score: 41.00
- Duration of Fall Scenery Rank: 22
- Outdoor Recreation Rank: 16
- Entertainment Rank: 6
- Climate Rank: 25
12. Pennsylvania
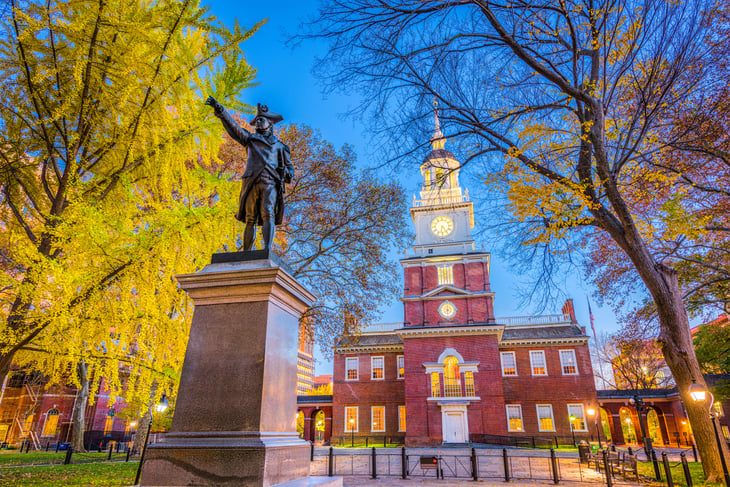
- Overall Score: 41.29
- Duration of Fall Scenery Rank: 17
- Outdoor Recreation Rank: 9
- Entertainment Rank: 7
- Climate Rank: 30
11. Michigan
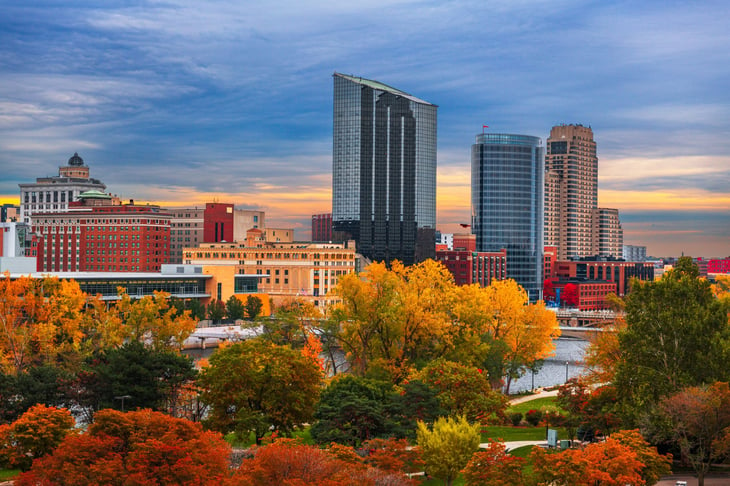
- Overall Score: 43.86
- Duration of Fall Scenery Rank: 21
- Outdoor Recreation Rank: 13
- Entertainment Rank: 5
- Climate Rank: 11
10. Colorado
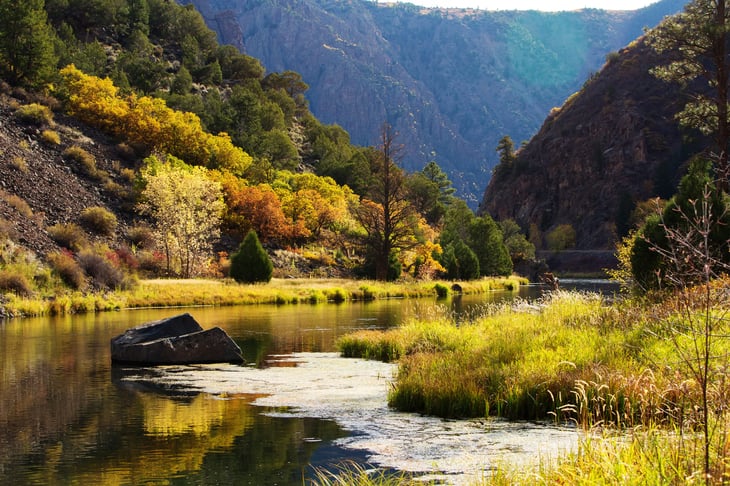
- Overall Score: 43.90
- Duration of Fall Scenery Rank: 11
- Outdoor Recreation Rank: 10
- Entertainment Rank: 32
- Climate Rank: 6
9. Utah
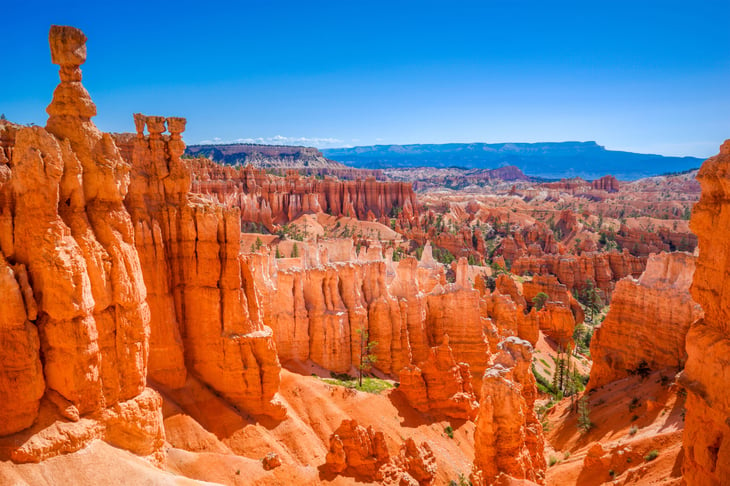
- Overall Score: 44.35
- Duration of Fall Scenery Rank: 2
- Outdoor Recreation Rank: 17
- Entertainment Rank: 34
- Climate Rank: 14
8. Maine
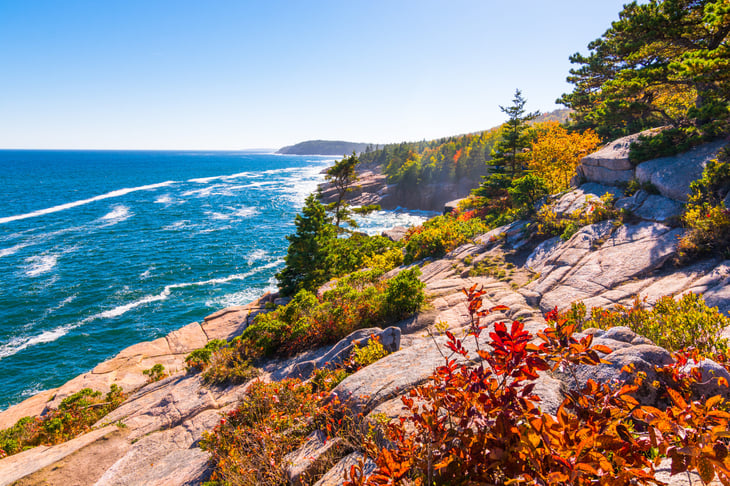
- Overall Score: 45.17
- Duration of Fall Scenery Rank: 24
- Outdoor Recreation Rank: 5
- Entertainment Rank: 2
- Climate Rank: 19
7. Oregon
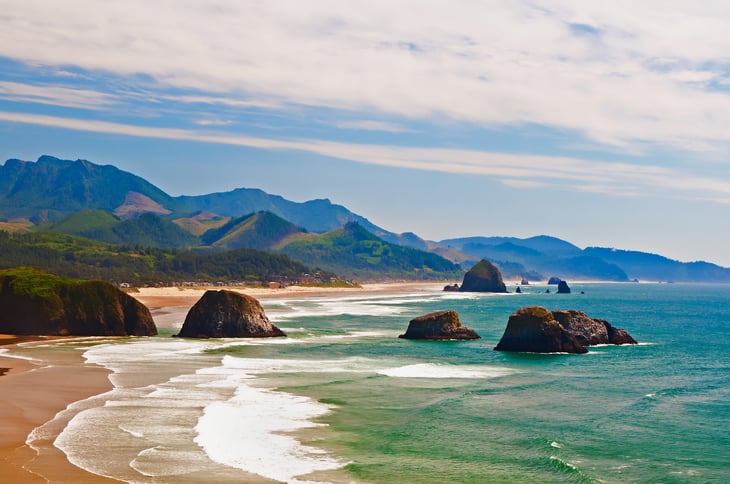
- Overall Score: 45.86
- Duration of Fall Scenery Rank: 3
- Outdoor Recreation Rank: 14
- Entertainment Rank: 11
- Climate Rank: 35
6. North Carolina
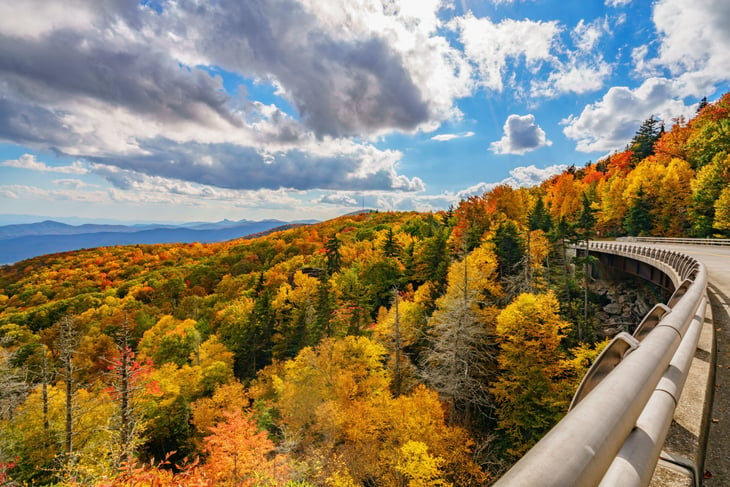
- Overall Score: 46.59
- Duration of Fall Scenery Rank: 6
- Outdoor Recreation Rank: 7
- Entertainment Rank: 9
- Climate Rank: 37
5. New York
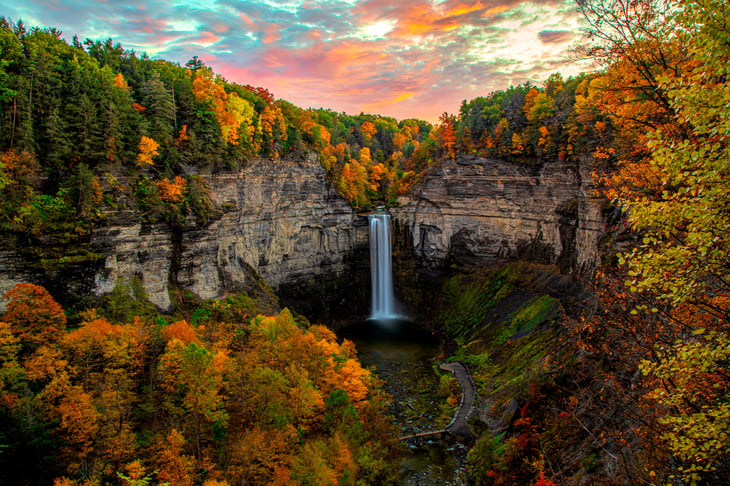
- Overall Score: 47.33
- Duration of Fall Scenery Rank: 10
- Outdoor Recreation Rank: 3
- Entertainment Rank: 12
- Climate Rank: 31
4. Virginia
- Overall Score: 47.62
- Duration of Fall Scenery Rank: 4
- Outdoor Recreation Rank: 8
- Entertainment Rank: 16
- Climate Rank: 18
3. Washington
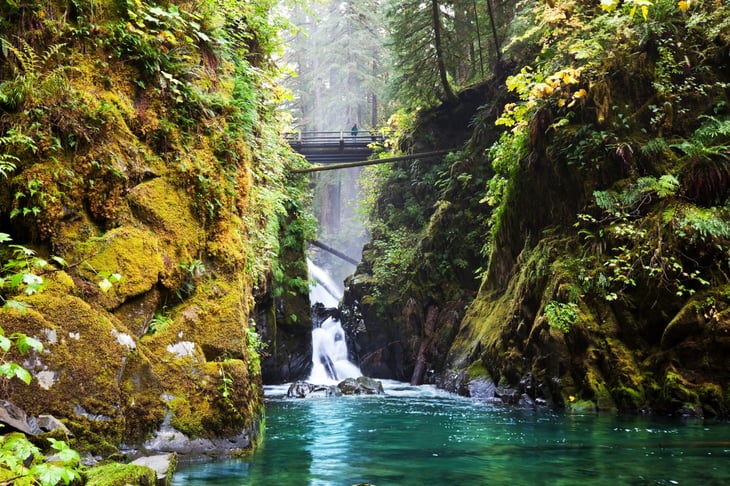
- Overall Score: 48.08
- Duration of Fall Scenery Rank: 8
- Outdoor Recreation Rank: 2
- Entertainment Rank: 17
- Climate Rank: 34
2. Vermont
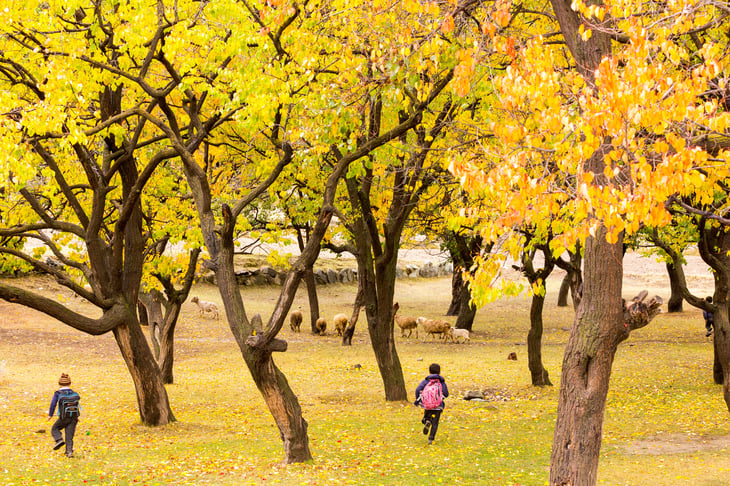
- Overall Score: 54.70
- Duration of Fall Scenery Rank: 29
- Outdoor Recreation Rank: 12
- Entertainment Rank: 1
- Climate Rank: 9
1. California
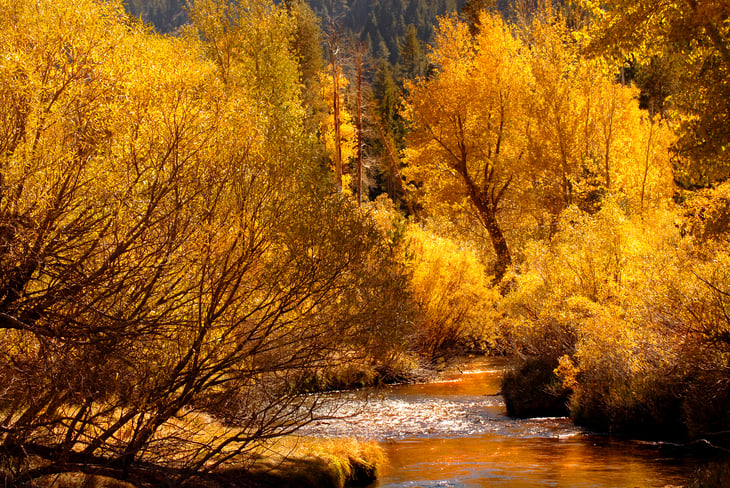
- Overall Score: 60.80
- Duration of Fall Scenery Rank: 1
- Outdoor Recreation Rank: 1
- Entertainment Rank: 8
- Climate Rank: 45
Methodology

To rank the Best States for Fall Festivities, we compared the 48 contiguous U.S. states across 24 metrics.
Our fall metrics covered four major themes:
- Duration of fall scenery (21%): We counted up the projected number of weeks with fall foliage and the projected number of days with peak foliage, according to the Smoky Mountains Fall Foliage Prediction Map and Explore Fall’s Live Map.
- Outdoor recreation (36%): We looked at the number of scenic drives, the number and size of state and national parks, total acreage of forest land, and the portion of the state with forest land, access to forest trails, hiking trails, and camping-friendliness.
- Entertainment (30%): We considered the total number of fall festivals, as well as destinations such as apple orchards, corn mazes, pumpkin patches, wineries, cideries, hayrides, and maple farms, per 100,000 residents.
- Climate (13%): We factored in the Natural Hazards index from FEMA, average fall temperatures, precipitation rates, and climate change risk according to the University of Notre Dame.
For each of the 48 contiguous U.S. states, we then gathered data on each factor from the sources listed below the table. Alaska and Hawaii were not included due to a lack of data available.
Finally, we calculated scores (out of 100 points) for each state to determine its rank in each factor, each category, and overall. A state’s Overall Score is the average of its scores across all factors and categories. The highest Overall Score ranked “Best” (No. 1).
Here are the metrics:
- Projected Number of Weeks With Fall Foliage
- Projected Number of Days of Peak Fall Foliage
- Number of Scenic Drives
- Number of National Parks
- Number of State Parks
- Total Acreage of State and National Parks
- Portion of State Covered by National and State Parks
- Total Acreage of Forest Land
- Portion of State Covered by Forest Land
- Number of Forest Trails
- Number of Hiking Trails
- State Camping-Friendliness Rank
- Number of Fall Festivals
- Apple Orchards per 100,000 Residents
- Corn Mazes per 100,000 Residents
- Pumpkin Patches per 100,000 Residents
- Wineries per 100,000 Residents
- Cideries per 100,000 Residents
- Hayrides per 100,000 Residents
- Maple Farms per 100,000 Residents
- Natural Hazard Index
- Temperatures During Fall Months
- Precipitation During Fall Months
- Climate Change Risk Score

Add a Comment