


Editor's Note: This story originally appeared on Upgraded Points.
The holiday season is in full swing, and for U.S. retailers, it is often the busiest season of the year for consumer spending.
Holiday spending in the U.S. is estimated to total nearly $1 trillion in 2023 as shoppers rush to buy gifts, food, and decorations and take advantage of retailers’ steep discounts.
However, the overall strength of consumer spending obscures how trends in retail have shifted over time, often creating challenges for local stores.
The pandemic played a part in accelerating a major trend that has impacted the sector in recent years: the growing shift toward e-commerce and the decline of brick-and-mortar retail.
This decline has been felt differently across the U.S.
The following is a breakdown of the top major metropolitan areas where brick-and-mortar retailers are declining. The analysis was conducted by Upgraded Points using data from the U.S. Census Bureau.
1. San Jose-Sunnyvale-Santa Clara, CA

- Percentage Change in Retail Stores (Per Capita): -23.6%
- Retail Stores per 1,000 Population (2021): 2.0
- Retail Stores per 1,000 Population (2011): 2.6
- Percentage Change in Retail Stores (Overall): -16.1%
- Total Change in Retail Stores (Overall): -760
- Total Retail Stores (2021): 3,960
- Total Retail Stores (2011): 4,720
2. Seattle-Tacoma-Bellevue, WA

- Percentage Change in Retail Stores (Per Capita): -22.8%
- Retail Stores per 1,000 Population (2021): 2.3
- Retail Stores per 1,000 Population (2011): 3.0
- Percentage Change in Retail Stores (Overall): -9.9%
- Total Change in Retail Stores (Overall): -1,012
- Total Retail Stores (2021): 9,171
- Total Retail Stores (2011): 10,183
3. San Francisco-Oakland-Berkeley, CA

- Percentage Change in Retail Stores (Per Capita): -19.8%
- Retail Stores per 1,000 Population (2021): 2.3
- Retail Stores per 1,000 Population (2011): 2.9
- Percentage Change in Retail Stores (Overall): -11.7%
- Total Change in Retail Stores (Overall): -1,457
- Total Retail Stores (2021): 11,021
- Total Retail Stores (2011): 12,478

4. Salt Lake City, UT

- Percentage Change in Retail Stores (Per Capita): -19.4%
- Retail Stores per 1,000 Population (2021): 2.4
- Retail Stores per 1,000 Population (2011): 2.9
- Percentage Change in Retail Stores (Overall): -6.5%
- Total Change in Retail Stores (Overall): -204
- Total Retail Stores (2021): 2,930
- Total Retail Stores (2011): 3,134
5. Austin-Round Rock-Georgetown, TX

- Percentage Change in Retail Stores (Per Capita): -19.3%
- Retail Stores per 1,000 Population (2021): 2.5
- Retail Stores per 1,000 Population (2011): 3.1
- Percentage Change in Retail Stores (Overall): +7.2%
- Total Change in Retail Stores (Overall): +370
- Total Retail Stores (2021): 5,501
- Total Retail Stores (2011): 5,131
6. Washington-Arlington-Alexandria, DC-VA-MD-WV

- Percentage Change in Retail Stores (Per Capita): -18.8%
- Retail Stores per 1,000 Population (2021): 2.3
- Retail Stores per 1,000 Population (2011): 2.8
- Percentage Change in Retail Stores (Overall): -7.7%
- Total Change in Retail Stores (Overall): -1,182
- Total Retail Stores (2021): 14,255
- Total Retail Stores (2011): 15,437
7. Tucson, AZ
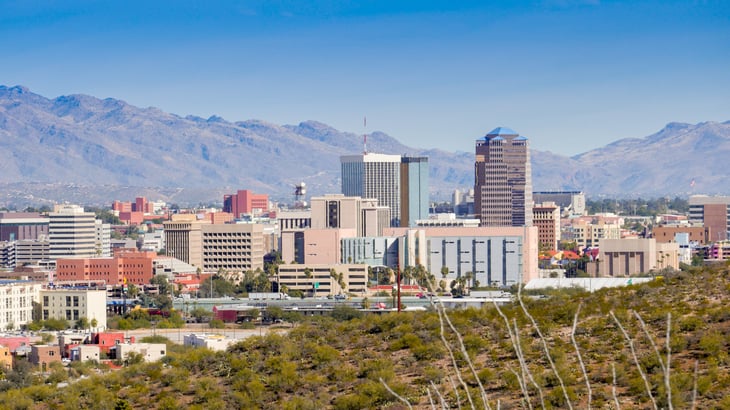
- Percentage Change in Retail Stores (Per Capita): -18.4%
- Retail Stores per 1,000 Population (2021): 2.2
- Retail Stores per 1,000 Population (2011): 2.7
- Percentage Change in Retail Stores (Overall): -13.3%
- Total Change in Retail Stores (Overall): -351
- Total Retail Stores (2021): 2,289
- Total Retail Stores (2011): 2,640
8. Phoenix-Mesa-Chandler, AZ
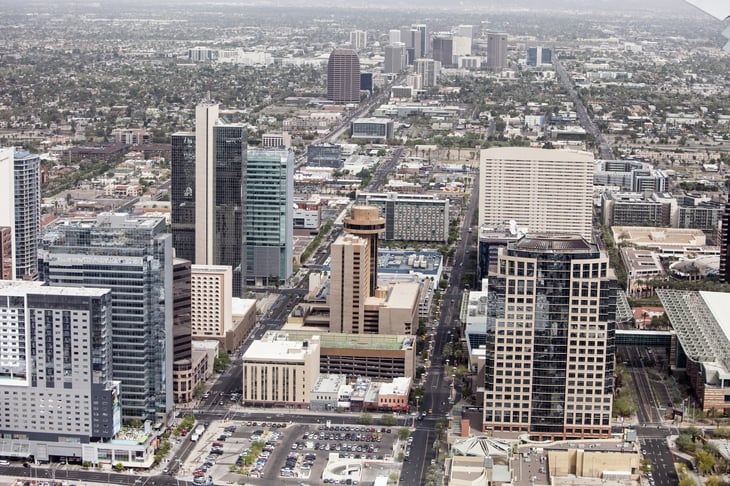
- Percentage Change in Retail Stores (Per Capita): -18.4%
- Retail Stores per 1,000 Population (2021): 2.0
- Retail Stores per 1,000 Population (2011): 2.5
- Percentage Change in Retail Stores (Overall): -5.8%
- Total Change in Retail Stores (Overall): -607
- Total Retail Stores (2021): 9,777
- Total Retail Stores (2011): 10,384
9. Orlando-Kissimmee-Sanford, FL
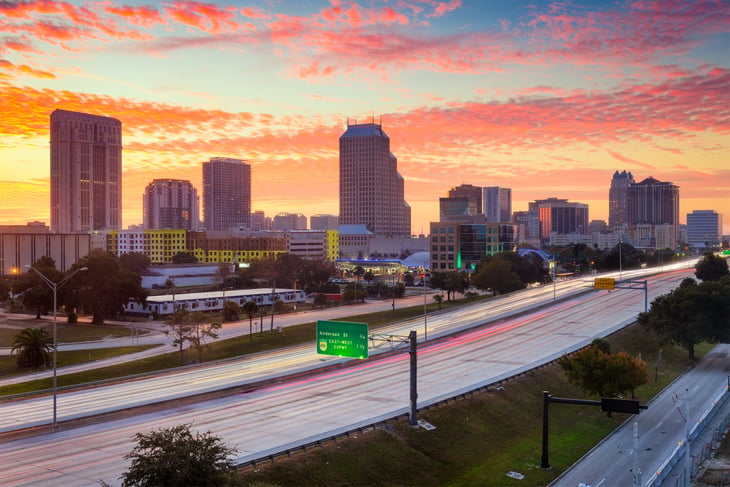
- Percentage Change in Retail Stores (Per Capita): -18.3%
- Retail Stores per 1,000 Population (2021): 3.0
- Retail Stores per 1,000 Population (2011): 3.6
- Percentage Change in Retail Stores (Overall): +1.7%
- Total Change in Retail Stores (Overall): +134
- Total Retail Stores (2021): 7,808
- Total Retail Stores (2011): 7,674
10. Minneapolis-St. Paul-Bloomington, MN-WI

- Percentage Change in Retail Stores (Per Capita): -17.0%
- Retail Stores per 1,000 Population (2021): 2.4
- Retail Stores per 1,000 Population (2011): 2.9
- Percentage Change in Retail Stores (Overall): -8.3%
- Total Change in Retail Stores (Overall): -811
- Total Retail Stores (2021): 8,930
- Total Retail Stores (2011): 9,741
11. Urban Honolulu, HI

- Percentage Change in Retail Stores (Per Capita): -16.7%
- Retail Stores per 1,000 Population (2021): 2.4
- Retail Stores per 1,000 Population (2011): 2.9
- Percentage Change in Retail Stores (Overall): -10.5%
- Total Change in Retail Stores (Overall): -290
- Total Retail Stores (2021): 2,473
- Total Retail Stores (2011): 2,763
12. Richmond, VA

- Percentage Change in Retail Stores (Per Capita): -16.7%
- Retail Stores per 1,000 Population (2021): 2.8
- Retail Stores per 1,000 Population (2011): 3.4
- Percentage Change in Retail Stores (Overall): -7.8%
- Total Change in Retail Stores (Overall): -311
- Total Retail Stores (2021): 3,690
- Total Retail Stores (2011): 4,001
13. Raleigh-Cary, NC

- Percentage Change in Retail Stores (Per Capita): -16.0%
- Retail Stores per 1,000 Population (2021): 2.7
- Retail Stores per 1,000 Population (2011): 3.3
- Percentage Change in Retail Stores (Overall): +5.9%
- Total Change in Retail Stores (Overall): +213
- Total Retail Stores (2021): 3,817
- Total Retail Stores (2011): 3,604
14. Indianapolis-Carmel-Anderson, IN

- Percentage Change in Retail Stores (Per Capita): -15.9%
- Retail Stores per 1,000 Population (2021): 2.6
- Retail Stores per 1,000 Population (2011): 3.1
- Percentage Change in Retail Stores (Overall): -6.0%
- Total Change in Retail Stores (Overall): -343
- Total Retail Stores (2021): 5,372
- Total Retail Stores (2011): 5,715
15. Boston-Cambridge-Newton, MA-NH

- Percentage Change in Retail Stores (Per Capita): -15.8%
- Retail Stores per 1,000 Population (2021): 2.9
- Retail Stores per 1,000 Population (2011): 3.4
- Percentage Change in Retail Stores (Overall): -8.5%
- Total Change in Retail Stores (Overall): -1,326
- Total Retail Stores (2021): 14,219
- Total Retail Stores (2011): 15,545
Methodology

The data used in this study is from the latest U.S. Census Bureau’s County Business Patterns (CBP) release.
To determine the locations that have experienced the largest decline in brick-and-mortar retail, researchers at Upgraded Points calculated the percentage change in the number of retail store establishments per capita over the 10 years between 2011 and 2021.
For this analysis, retail store establishments exclude “nonstore” retailers, such as e-commerce businesses.
Add a Comment
Our Policy: We welcome relevant and respectful comments in order to foster healthy and informative discussions. All other comments may be removed. Comments with links are automatically held for moderation.