‘Tis the season to pay taxes, and many of us wonder just how that money is used, especially in our states.
States spend tax revenue to pay for education, transportation and other infrastructure, public safety, correctional facilities and social safety-net programs, including unemployment insurance and workers’ compensation.
RewardExpert analyzed data from the Survey of State and Local Government Finances conducted by the U.S. Census Bureau to determine which states give residents the best return on their investment.
They point out that paying the least income tax is not necessarily the best deal:
In order to have lower taxes, citizens must sacrifice some of these (state-funded services), or else pay more in fees and charges, such as highway tolls, tuition at state universities and community colleges, utility bills, and so forth.
The study calculated the value that residents receive from governmental spending, compared with various taxes and charges paid by residents.
Here are the RewardExpert results, beginning with the state that ranked lowest for its return on taxpayer dollars. How the calculation works is spelled out further below:
50. Hawaii

As a steward of its residents’ tax dollars, Hawaii was at the bottom of the heap. Here’s how the report explains it:
Coming in dead last in terms of the value of its residents’ tax dollars is the state of Hawaii, which is the only state whose residents pay more in taxes per capita than state and local governments spend. Negative bang for their bucks, as it were. Revenue collected from individual taxpayers ranks sixth in the nation, while revenue from corporate income taxes ranks 45th. Taxes in Hawaii make up 51.79% of all government revenues (seventh highest in the nation). While government expenditures on infrastructure and facilities is considerable, residents still pay on average more than the value of services received.
Here are the numbers:
Per capita tax: $6,942.53
*In this post, “per capita tax” refers to the sum total of state income tax, sales tax, property tax and other fees and tolls that a state resident pays.
Government expenditures per capita: $6,825.88
Return on investment: -0.16 percent
*Return on investment is calculated as the ratio of expenditures that benefit individual taxpayers to the tax revenue collected from them. This value is adjusted for average income.
Residents’ taxes as a percent of total state revenue: 51.79 percent (Rank among states: 7)
*State revenue is the sum of individuals’ income tax, property tax, sales tax and other government fees, plus corporate tax and revenue generated by investments, securities, trust funds and so on.
For more on the methodology of the study, click here.
49. North Dakota

Per capita tax: $9,465.36
Government expenditures per capita: $9,532.74
Return on investment: 0.11 percent
Taxes as a percentage of total state revenue: 56.22 percent (Rank among states: 3)
48. Connecticut

Per capita tax: $7,731.83
Government expenditures per capita: $7,860.78
Return on investment: 0.20 percent
Taxes as a percentage of total state revenue: 61.78 percent (Rank among states: 1)
47. Nevada

Per capita tax: $5,059.25
Government expenditures per capita: $5,259.82
Return on investment: 0.38 percent
Taxes as a percentage of total state revenue: 46.59 percent (Rank among states: 17)
46. New Hampshire

According to the RewardExpert study, “New Hampshire lacks both personal and corporate income taxes, as well as a statewide sales tax,” and as a result, the state and local governments rely heavily on property taxes, liquor store revenues and fees for services to pay for services and infrastructure.
Per capita tax: $4,725.00
Government expenditures per capita: $5,469.76
Return on investment: 1.06 percent
Taxes as a percentage of total state revenue: 50.41 percent (Rank among states: 10)
45. Virginia

Per capita tax: $4,822.10
Government expenditures per capita: $5,548.30
Return on investment: 1.10 percent
Taxes as a percentage of total state revenue: 47.76 percent (Rank among states: 15)
44. Indiana
Per capita tax: $4,098.72
Government expenditures per capita: $4,775.48
Return on investment: 1.34 percent
Taxes as a percentage of total state revenue: 44.06 percent (Rank among states: 22)
43. New Jersey

According to the RewardExpert report:
With the highest property taxes per capita in the nation, coupled with income taxes in the top ten, New Jersey plays second fiddle only to Connecticut when it comes to the share of all government revenue that come from taxes paid into its coffers.
The state also rakes in a lot of cash on turnpike tolls to offset highway spending, it notes.
Per capita tax: $6,548.81
Government expenditures per capita: $7,552.43
Return on investment: 1.39 percent
Taxes as a percentage of total state revenue: 56.45 percent (Rank among states: 2)
42. Colorado

Per capita tax: $4,789.86
Government expenditures per capita: $5,845.36
Return on investment: 1.40 percent
Taxes as a percentage of total state revenue: 42.61 percent (Rank among states: 29)
41. Maryland

Per capita tax: $6,343.28
Government expenditures per capita: $7,430.94
Return on investment: 2.01 percent
Taxes as a percentage of total state revenue: 54.08 percent (Rank among states: 5)
40. Texas

Per capita tax: $4,749.16
Government expenditures per capita: $5,558.92
Return on investment: 1.46 percent
Taxes as a percentage of total state revenue: 47.46 percent (Rank among states: 16)
39. Utah

Per capita tax: $3,859.23
Government expenditures per capita: $4,851.98
Return on investment: 1.58 percent
Taxes as a portion of revenue: 39.54 percent (Rank among states: 42)
38. Illinois

Per capita tax: $5,912.85
Government expenditures per capita: $6,904.65
Return on investment: 1.66 percent
Taxes as a percentage of total state revenue: 53.98 percent (Rank among states: 6)
37. Maine

Per capita tax: $5,412.04
Government expenditures per capita: $6,276.15
Return on investment: 1.68 percent
Taxes as a percentage of total state revenue: 54.50 percent (Rank among states: 4)
36. Kansas

Per capita tax: $4,524.12
Government expenditures per capita: $5,444.82
Return on investment: 1.71 percent
Taxes as a percentage of total state revenue: 46.07 percent (Rank among states: 18)
35. Minnesota

Per capita tax: $6,288.82
Government expenditures per capita: $7,416.32
Return on investment: 1.78 percent
Taxes as a percentage of total state revenue: 49.30 percent (Rank among states: 11)
34. Florida

Per capita tax: $3,850.85
Government expenditures per capita: $4,835.35
Return on investment: 1.99 percent
Taxes as a percentage of total state revenue: 41.97 percent (Rank among states: 33)
33. Ohio
Per capita tax: $4,908.59
Government expenditures per capita: $5,933.05
Return on investment: 2.01 percent
Taxes as a percentage of total state revenue: 41.43 percent (Rank among states: 41)
32. Idaho
Per capita tax: $3,529.84
Government expenditures per capita: $4,508.18
Return on investment: 2.03 percent
Taxes as a percentage of total state revenue: 44.01 percent (Rank among states: 23)
31. North Carolina

Per capita tax: $4,016.75
Government expenditures per capita: $5,034.56
Return on investment: 2.13 percent
Taxes as a percentage of total state revenue: 42.87 percent (Rank among states: 27)
30. Georgia

Per capita tax: $3,691.69
Government expenditures per capita: $4,793.64
Return on investment: 2.15 percent
Taxes as a percentage of total state revenue: 45.54 percent (Rank among states: 19)
29. Nebraska

Per capita tax: $5,025.83
Government expenditures per capita: $6,265.50
Return on investment: 2.25 percent
Taxes as a percentage of total state revenue: 41.46 percent (Rank among states: 40)
28. South Dakota

Per capita tax: $4,356.19
Government expenditures per capita: $5,580.82
Return on investment: 2.31 percent
Taxes as a percentage of total state revenue: 43.15 percent (Rank among states: 25)
27. Rhode Island

Per capita tax: $5,754.05
Government expenditures per capita: $7,095.93
Return on investment: 2.31 percent
Taxes as a percentage of total state revenue: 48.75 percent (Rank among states: 12)
26. Missouri

Per capita tax: $3,869.46
Government expenditures per capita: $5,128.94
Return on investment: 2.51 percent
Taxes as a percentage of total state revenue: 41.65 percent (Rank among states: 34)
25. Michigan

Per capita tax: $4,245.45
Government expenditures per capita: $5,551.72
Return on investment: 2.56 percent
Taxes as a percentage of total state revenue: 41.63 percent (Rank among states: 36)
24. Washington

Per capita tax: $5,532.05
Government expenditures per capita: $7,189.91
Return on investment: 2.59 percent
Taxes as a percentage of total state revenue: 41.48 percent (Rank among states: 39)
23. South Carolina

Per capita tax: $3,643.75
Government expenditures per capital: $4,870.20
Return on investment: 2.60 percent
Taxes as a percentage of total state revenue: 36.67 percent (Rank among states: 45)
22. Pennsylvania

Per capita tax: $5,244.96
Government expenditures per capita: $6,760.58
Return on investment: 2.72 percent
Taxes as a percentage of total state revenue: 47.97 percent (Rank among states: 14)
21. Oklahoma

Per capita tax: $3,952.33
Government expenditures per capita: $5,317.45
Return on investment: 2.81 percent
Taxes as a percentage of total state revenue: 41.49 percent (Rank among states: 38)
20. Arizona

Per capita tax: $3,591.09
Government expenditures per capita: $5,040.15
Return on investment: 2.81 percent
Taxes as a percentage of total state revenue: 42.37 percent (Rank among states: 31)
19. Alabama

Per capita tax: $3,555.74
Government expenditures per capita: $4,865.47
Return on investment: 2.93 percent
Taxes as a percentage of total state revenue: 36.31 percent (Rank among states: 46)
18. Tennessee

Per capita tax: $3,381.82
Government expenditures per capita: $4,766.74
Return on investment: 2.93 percent
Taxes as a percentage of total state revenue: 38.13 percent (Rank among states: 43)
17. Iowa

Per capita tax: $5,000.54
Government expenditures per capita: $6,647.30
Return on investment: 3.01 percent
Taxes as a percentage of total state revenue: 42.63 percent (Rank among states: 28)
16. Massachusetts

Per capita tax: $6,113.72
Government expenditures per capita: $8,262.35
Return on investment: 3.04 percent
Taxes as a percentage of total state revenue: 51.17 percent (Rank among states: 8)
15. Montana

Per capita tax: $4,364.46
Government expenditures per capita: $6,086.48
Return on investment: 3.48 percent
Taxes as a percentage of total state revenue: 41.61 percent (Rank among states: 37)
14. Wisconsin

Per capita tax: $4,810.29
Government expenditures per capita: $6,748.68
Return on investment: 3.48 percent
Taxes as a percentage of total state revenue: 45.51 percent (Rank among states: 20)
13. California

Per capita tax: $5,891.29
Government expenditures per capita: $8,217.41
Return on investment: 3.61 percent
Taxes as a percentage of total state revenue: 44.77 percent (Rank among states: 21)
12. West Virginia

Per capita tax: $4,714.55
Government expenditures per capita: $6,254.06
Return on investment: 3.66 percent
Taxes as a percentage of total state revenue: 42.11 percent (Rank among states: 32)
11. Louisiana

Per capita tax: $4,437.60
Government expenditures per capita: $6,144.70
Return on investment: 3.73 percent
Taxes as a percentage of total state revenue: 42.58 percent
10. Vermont

Per capita tax: $6,542.02
Government expenditures per capita: $8,753.07
Return on investment: 3.88 percent
Taxes as a percentage of total state revenue: 48.15 percent (Rank among states: 13)
9. Oregon

Per capita tax: $4,650.15
Government expenditures per capita: $6,757.91
Return on investment: 3.89 percent
Taxes as a percentage of total state revenue: 36.01 percent (Rank among states: 47)
8. Mississippi
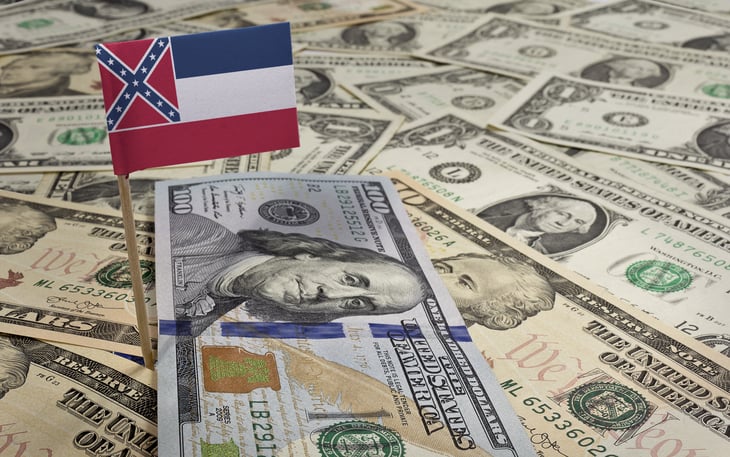
Per capita tax: $3,886.77
Government expenditures per capita: $5,607.24
Return on investment: 4.24 percent
Taxes as a percentage of total state revenue: 37.49 percent (Rank among states: 44)
7. Arkansas

Per capita tax: $4,053.52
Government expenditures per capita: $5,958.16
Return on investment: 4.54 percent
Taxes as a percentage of total state revenue: 42.91 percent (Rank among states: 26)
6. Delaware

Per capita tax: $4,468.53
Government expenditures per capita: $7,335.28
Return on investment: 4.68 percent
Taxes as a percentage of total state revenue: 43.68 percent (Rank among states: 24)
5. New York

New York has notoriously high taxes, the RewardExpert analysis notes. But the state is among the top in returning value to its residents for that tax money. Here’s part of the reason, according to RewardExpert:
With most of the major players in the global economy doing business in New York City, corporate income tax revenues are a significant source of government funding. As such, government spending on items of value to the average taxpayer exceeds per capita tax revenues by an amount equal to 4.72% of the statewide average per capita income.
Per capita tax: $8,177.15
Government expenditures per capita: $11,046.25
Return on investment: 4.72 percent
Taxes as a percentage of total state revenue: 51.02 percent (Rank among states: 9)
4. Kentucky

Per capita tax: $4,048.87
Government expenditures per capita: $6,334.21
Return on investment: 5.05 percent
Taxes as a percentage of total state revenue: 41.64 percent (Rank among states: 35)
3. Wyoming

Per capita tax: $6,829.28
Government expenditures per capita: $9,987.96
Return on investment: 5.25 percent
Taxes as a percentage of total state revenue: 35.84 percent (Rank among states: 48)
2. New Mexico

Per capita tax: $4,337.18
Government expenditures per capita: $7,722.06
Return on investment: 7.46 percent
Taxes as a percentage of total state revenue: 35.82 percent (Rank among states: 49)
1. Alaska

Alaska is the state that was deemed to offer the best return on the average resident’s tax dollar. Why? Here’s how RewardExpert explains the great value:
This is made possible, on the one hand, by oil and gas revenues, and on the other, by the fact that unlike other states lacking a personal income tax, Alaska does impose an income tax on corporate incomes.
Per capita tax: $3,430.68
Government expenditures per capita: $12,512.07
Return on investment: 12.38 percent
Taxes as a percentage of total state revenue: 22.54 percent (Rank among states: 50)
How does your state line up for return on your tax dollars? Share with us in comments below or on our Facebook page.


Add a Comment
Our Policy: We welcome relevant and respectful comments in order to foster healthy and informative discussions. All other comments may be removed. Comments with links are automatically held for moderation.