


Editor's Note: This story originally appeared on Flippa.
The U.S. economy has continued to defy pessimistic expectations in recent months, with employment, wages and consumer spending remaining resilient amid high inflation and rising interest rates.
But one part of the economy that has retracted is venture capital investment.
High interest rates have pushed venture investors to be more conservative, making it harder for new startups to raise funding and leading to widespread layoffs in many venture-backed companies.
Venture capital investment is most robust in a select group of states that tend to have strong startup economies, including networks of existing entrepreneurs, a well-educated workforce and capabilities in high-growth industries.
The following is a breakdown of the states with the largest growth in venture capital investment over the past decade.
The analysis was conducted by Flippa, a marketplace to buy and sell digital businesses, using data retrieved from the National Science Foundation. For more information on calculations and methods, refer to the methodology section at the end.
1. Wyoming

- VC funding growth relative to GDP (2012–2022): +57.9X
- VC funding per $1M GDP (2022): $16,150
- VC funding per $1M GDP (2012): $279
- Total VC funding (2022): $792,640,000
- Total VC funding (2012): $10,840,000
- Average deal size (2022): $11,490,000
- Average deal size (2012): $1,200,000
- Number of deals (2022): 69
- Number of deals (2012): 9
2. Idaho

- VC funding growth relative to GDP (2012–2022): +20.8X
- VC funding per $1M GDP (2022): $3,694
- VC funding per $1M GDP (2012): $177
- Total VC funding (2022): $409,590,000
- Total VC funding (2012): $10,350,000
- Average deal size (2022): $5,390,000
- Average deal size (2012): $610,000
- Number of deals (2022): 76
- Number of deals (2012): 17
3. Alaska

- VC funding growth relative to GDP (2012–2022): +16.8X
- VC funding per $1M GDP (2022): $1,813
- VC funding per $1M GDP (2012): $108
- Total VC funding (2022): $119,140,000
- Total VC funding (2012): $6,290,000
- Average deal size (2022): $3,400,000
- Average deal size (2012): $1,570,000
- Number of deals (2022): 35
- Number of deals (2012): 4

4. Vermont

- VC funding growth relative to GDP (2012–2022): +16.3X
- VC funding per $1M GDP (2022): $13,481
- VC funding per $1M GDP (2012): $827
- Total VC funding (2022): $550,440,000
- Total VC funding (2012): $24,190,000
- Average deal size (2022): $8,220,000
- Average deal size (2012): $1,100,000
- Number of deals (2022): 67
- Number of deals (2012): 22
5. Delaware

- VC funding growth relative to GDP (2012–2022): +13.4X
- VC funding per $1M GDP (2022): $27,235
- VC funding per $1M GDP (2012): $2,026
- Total VC funding (2022): $2,456,860,000
- Total VC funding (2012): $126,300,000
- Average deal size (2022): $4,320,000
- Average deal size (2012): $1,910,000
- Number of deals (2022): 569
- Number of deals (2012): 66
6. Louisiana

- VC funding growth relative to GDP (2012–2022): +10.2X
- VC funding per $1M GDP (2022): $1,111
- VC funding per $1M GDP (2012): $109
- Total VC funding (2022): $324,450,000
- Total VC funding (2012): $25,750,000
- Average deal size (2022): $3,380,000
- Average deal size (2012): $610,000
- Number of deals (2022): 96
- Number of deals (2012): 42
7. Illinois

- VC funding growth relative to GDP (2012–2022): +9.9X
- VC funding per $1M GDP (2022): $10,768
- VC funding per $1M GDP (2012): $1,087
- Total VC funding (2022): $11,044,430,000
- Total VC funding (2012): $789,320,000
- Average deal size (2022): $15,050,000
- Average deal size (2012): $2,600,000
- Number of deals (2022): 734
- Number of deals (2012): 304
8. Nebraska
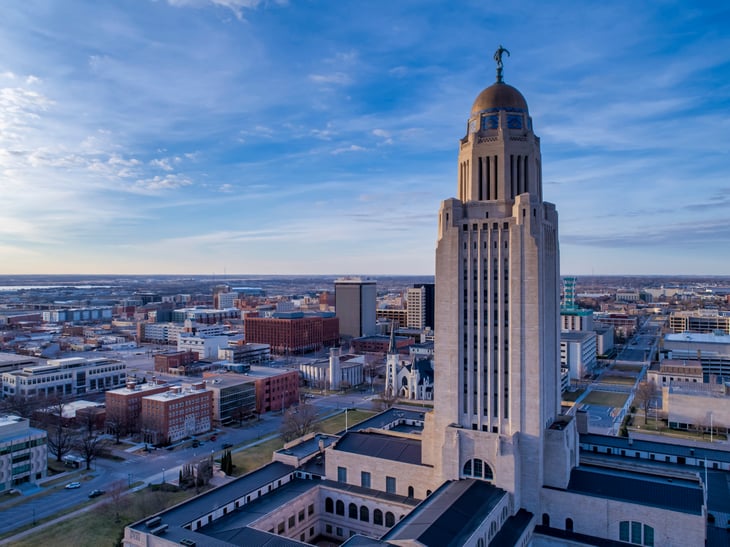
- VC funding growth relative to GDP (2012–2022): +9.5X
- VC funding per $1M GDP (2022): $3,042
- VC funding per $1M GDP (2012): $320
- Total VC funding (2022): $501,750,000
- Total VC funding (2012): $32,890,000
- Average deal size (2022): $6,190,000
- Average deal size (2012): $1,500,000
- Number of deals (2022): 81
- Number of deals (2012): 22
9. Arkansas

- VC funding growth relative to GDP (2012–2022): +9.4X
- VC funding per $1M GDP (2022): $1,861
- VC funding per $1M GDP (2012): $198
- Total VC funding (2022): $308,960,000
- Total VC funding (2012): $21,480,000
- Average deal size (2022): $3,910,000
- Average deal size (2012): $800,000
- Number of deals (2022): 79
- Number of deals (2012): 27
10. South Carolina

- VC funding growth relative to GDP (2012–2022): +8.4X
- VC funding per $1M GDP (2022): $2,234
- VC funding per $1M GDP (2012): $265
- Total VC funding (2022): $664,610,000
- Total VC funding (2012): $47,050,000
- Average deal size (2022): $5,070,000
- Average deal size (2012): $940,000
- Number of deals (2022): 131
- Number of deals (2012): 50
Methodology

The data used in this analysis comes from the U.S. Bureau of Economic Analysis and PitchBook, retrieved from the National Science Foundation’s “National Center for Science and Engineering.”
Researchers at Flippa compared total venture capital disbursed in each state relative to the state’s GDP in both 2022 and 2012 to determine those that experienced the most growth.
The data represents venture capital funding secured by companies in each state and includes all stages of financing, from seed to later-stage investments.
Add a Comment
Our Policy: We welcome relevant and respectful comments in order to foster healthy and informative discussions. All other comments may be removed. Comments with links are automatically held for moderation.