
This story originally appeared on SmartAsset.com.
The U.S. is a federal republic, meaning that power is held by both the central federal government, located in Washington, D.C., and by the governments of every state and territory that make up the union. But the “division of powers” isn’t as simple as it seems — and neither is the division of finances, since states rely on the federal government for money and various programs to help them operate. With all this in mind, SmartAsset crunched the numbers to see which states are the most dependent on the federal government.
To do this, we considered data on all 50 states across the following metrics: the federal share of state government revenue, the ratio of federal funding to income taxes paid, the percentage of workers employed by the federal government and the ratio of median earnings for federal workers to median earnings for private for-profit workers. For details on our data sources and how we put all the information together to create our final rankings, check out the Data and Methodology section at the end.
This is SmartAsset’s 2021 study on states most dependent on the federal government. Check out the 2020 version here.
1. New Mexico
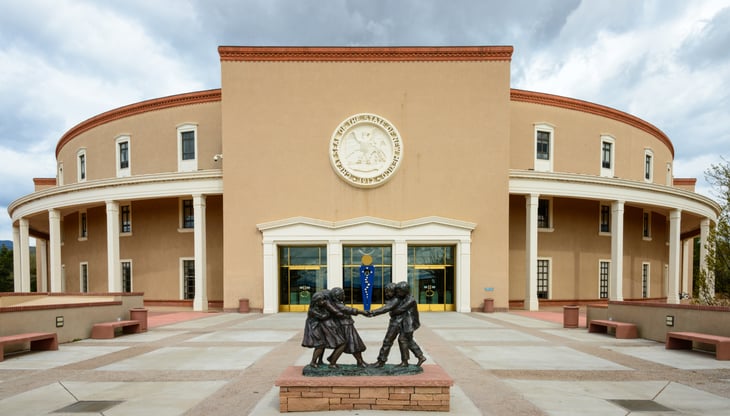
New Mexico once again leads this list. Nicknamed “Land of Enchantment,” this state has the third-highest ratio of median earnings of federal workers to private for-profit workers, at 2.25. New Mexico also has the fourth-highest percentage of workers employed by the federal government, at 6.04%. And the state ranks fourth overall for the ratio of federal funding to income taxes paid, at 1.79.
2. West Virginia

West Virginia is the No. 2 state most dependent on federal funding. The Mountaineer State has the third-highest ratio of federal funding to income taxes paid, at 1.88. The average federal worker in the state earns almost twice as much as the average private-sector worker, a metric for which the state ranks fourth overall. Roughly 3.58% of workers in West Virginia are employed by the federal government, ranking eighth for this metric across all 50 states.
3. Alabama

Alabama has a 1.11 ratio of federal funding to income taxes paid, the eighth-highest for this metric in the study. The ratio of pay for government workers to private for-profit workers is 1.95, the fifth-highest overall. And the state also has the 10th-highest percentage of workers employed by the federal government, at 3.38%.
4. Mississippi

Federal government money in Mississippi makes up 2.19 times more than the income taxes paid in the state, the second-highest ratio for this metric in our study. Federal funding represents 42.22% of the state’s government revenue, the fourth-highest percentage overall. Mississippi also finishes 12th for the share of workers employed by the federal government, at 3.01%.
5. Louisiana

Louisiana gets 46.42% of its budget from the federal government, the highest percentage in the study for this metric. The Bayou State also ranks seventh-highest for its 1.35 ratio of the amount of federal funding to income taxes paid. Federal employees make 1.75 times more than private-sector employees, the 10th-highest rate for this metric overall.
6. Alaska

Alaska places in the top five for three of the metrics that we measured. The Last Frontier has the third-highest federal share of state government revenue, at 42.82%. The state also ranks fifth for the ratio of federal funding to income taxes paid, at 1.46, and fifth for the percentage of its workers employed by the federal government, at 5.95%.
7. Arizona

Federal government funding makes up 40.85% of Arizona’s budget, the sixth-highest percentage for this metric in our study. The state also ranks 16th for two different metrics: the ratio of federal funding to income taxes paid (at 0.78) and the ratio of median earnings of federal workers to those of private for-profit workers (at 1.68).
8. Montana
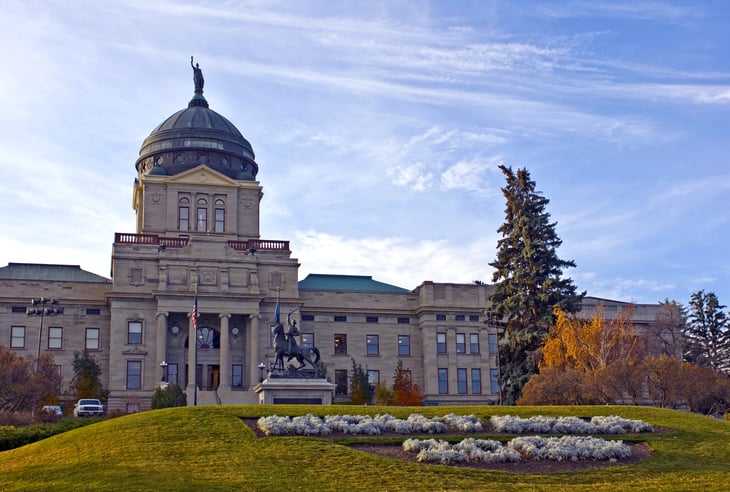
Federal government money makes up 43.73% of Montana’s revenue, the second-highest percentage in the study for this metric. The ratio of federal funding to income taxes paid is 1.06, the ninth-highest for this metric. And the state also ranks seventh for the percentage of workers employed by the federal government, at 3.77%.
9. Maine
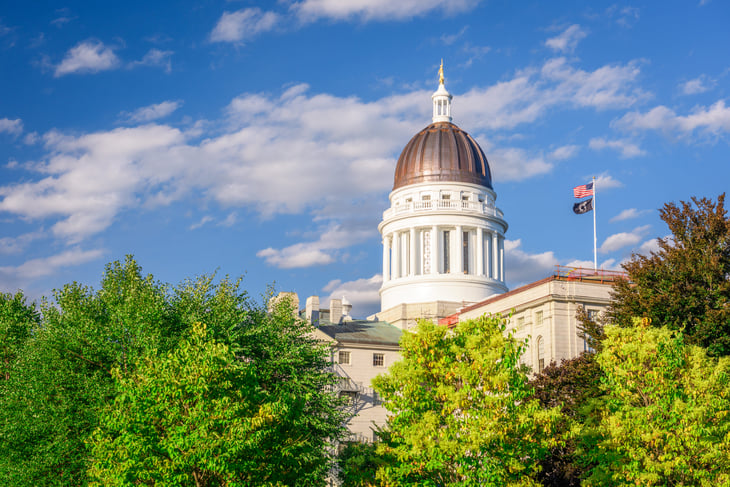
Maine has the eighth-highest ratio overall for median earnings for federal workers to private for-profit workers, at 1.76. The state also cracks the top 15 for the ratio of federal funding to income taxes paid, coming in 13th for this metric. For every dollar the state pays in taxes, it receives $0.85 of federal funding.
10. Wyoming
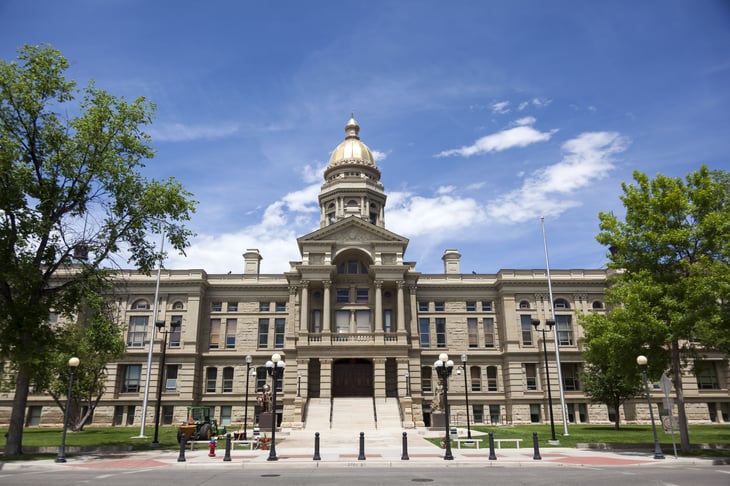
Wyoming rounds out the top 10 with 41.47% of its budget made up of federal funding, the fifth-highest in our study. Furthermore, 3.52% of workers in the state are employed by the federal government, ranking ninth for this metric nationwide. It also has the 12th-highest ratio of federal funding to income taxes paid ($0.91 from the federal government to every dollar in income taxes). The state’s overall ranking dips slightly, because it has the 44th-highest ratio of the median earnings of federal workers to those of private-sector employees ($1.44 earned by a federal worker for every dollar earned by a worker in the private sector).
Data and Methodology

To find the states that rely the most on the federal government, SmartAsset compared all 50 states across the following metrics:
- Federal share of state government revenue. This is the percentage of the state government’s revenue that comes from intergovernmental aid. Data comes from the U.S. Census Bureau’s 2019 Annual Survey of State Government Finances.
- Ratio of federal funding to income taxes paid. This is intergovernmental aid received by states divided by the net amount of income taxes paid by the state. Data comes from the U.S. Census Bureau’s 2019 Annual Survey of State Government Finances and the IRS. Tax data is for 2018.
- Percentage of workers employed by the federal government. This is the percentage of the state’s overall workforce that is employed by the federal government. Data comes from the U.S. Census Bureau’s 2019 1-year American Community Survey.
- Ratio of federal wage to private-sector wage. This is median earnings for a federal government worker in each state divided by median earnings for a private, for-profit worker in each state. Data comes from the U.S. Bureau’s 2019 1-year American Community Survey.
First, we ranked each state in each metric. Then we found each state’s average ranking, assigning each metric a full weight. We used this average ranking to create our final score. The state with the highest average ranking received a score of 100. The state with the lowest average ranking received a score of 0.


Add a Comment
Our Policy: We welcome relevant and respectful comments in order to foster healthy and informative discussions. All other comments may be removed. Comments with links are automatically held for moderation.