
Editor's Note: This story originally appeared on HireAHelper.
The COVID-19 pandemic was a massive blow to the U.S.’s public transit systems. As businesses shuttered their doors and workers stopped commuting into the office, public transit ridership dropped to as low as 10% of pre-pandemic levels in many places.
Now that the national emergency has ended and many companies are requiring their employees to return to the office in varying capacities, public transportation is rebounding.
However, public transit usage varies significantly by location. When considering where to live, the availability of public transportation is often an important deciding factor.
To determine the locations with the best public transportation, researchers at HireAHelper analyzed data from the Federal Transit Administration and from the U.S. Census Bureau. Find details on their methodology at the end.
Based on their composite scores, here are the U.S. metropolitan areas with the best public transportation.
15. Denver-Aurora-Lakewood, CO

- Composite score: 79.9
- Annual public transit trips per resident: 16.1
- Share of workers who commute by public transit: 1.7%
- Share of stations that are ADA accessible: 100.0%
- Share of passenger miles traveled using electric power: 30.6%
14. Los Angeles-Long Beach-Anaheim, CA

- Composite score: 81.4
- Annual public transit trips per resident: 20.8
- Share of workers who commute by public transit: 2.8%
- Share of stations that are ADA accessible: 97.2%
- Share of passenger miles traveled using electric power: 11.2%
13. Providence-Warwick, RI-MA

- Composite score: 82.8
- Annual public transit trips per resident: 23.7
- Share of workers who commute by public transit: 1.2%
- Share of stations that are ADA accessible: 81.3%
- Share of passenger miles traveled using electric power: 27.0%
12. Seattle-Tacoma-Bellevue, WA

- Composite score: 83.3
- Annual public transit trips per resident: 30.3
- Share of workers who commute by public transit: 3.0%
- Share of stations that are ADA accessible: 99.2%
- Share of passenger miles traveled using electric power: 9.6%
11. Minneapolis-St. Paul-Bloomington, MN-WI

- Composite score: 83.9
- Annual public transit trips per resident: 13.7
- Share of workers who commute by public transit: 1.7%
- Share of stations that are ADA accessible: 100.0%
- Share of passenger miles traveled using electric power: 7.0%
10. Pittsburgh, PA

- Composite score: 85.3
- Annual public transit trips per resident: 12.7
- Share of workers who commute by public transit: 2.4%
- Share of stations that are ADA accessible: 66.0%
- Share of passenger miles traveled using electric power: 4.2%
9. Salt Lake City, UT

- Composite score: 86.8
- Annual public transit trips per resident: 16.4
- Share of workers who commute by public transit: 2.0%
- Share of stations that are ADA accessible: 100.0%
- Share of passenger miles traveled using electric power: 17.9%
8. Boston-Cambridge-Newton, MA-NH

- Composite score: 87.3
- Annual public transit trips per resident: 21.4
- Share of workers who commute by public transit: 5.6%
- Share of stations that are ADA accessible: 84.1%
- Share of passenger miles traveled using electric power: 23.0%
7. Chicago-Naperville-Elgin, IL-IN-WI

- Composite score: 88.2
- Annual public transit trips per resident: 25.6
- Share of workers who commute by public transit: 4.8%
- Share of stations that are ADA accessible: 77.0%
- Share of passenger miles traveled using electric power: 38.5%
6. Portland-Vancouver-Hillsboro, OR-WA

- Composite score: 89.0
- Annual public transit trips per resident: 23.9
- Share of workers who commute by public transit: 2.3%
- Share of stations that are ADA accessible: 100.0%
- Share of passenger miles traveled using electric power: 19.4%
5. Baltimore-Columbia-Towson, MD

- Composite score: 89.6
- Annual public transit trips per resident: 23.0
- Share of workers who commute by public transit: 2.6%
- Share of stations that are ADA accessible: 93.6%
- Share of passenger miles traveled using electric power: 29.3%
4. San Francisco-Oakland-Berkeley, CA

- Composite score: 91.2
- Annual public transit trips per resident: 21.4
- Share of workers who commute by public transit: 4.9%
- Share of stations that are ADA accessible: 93.0%
- Share of passenger miles traveled using electric power: 32.0%
3. New York-Newark-Jersey City, NY-NJ-PA

- Composite score: 91.2
- Annual public transit trips per resident: 85.8
- Share of workers who commute by public transit: 19.0%
- Share of stations that are ADA accessible: 53.1%
- Share of passenger miles traveled using electric power: 49.1%
2. Philadelphia-Camden-Wilmington, PA-NJ-DE-MD

- Composite score: 92.4
- Annual public transit trips per resident: 20.7
- Share of workers who commute by public transit: 4.7%
- Share of stations that are ADA accessible: 53.2%
- Share of passenger miles traveled using electric power: 29.4%
1. Washington-Arlington-Alexandria, DC-VA-MD-WV
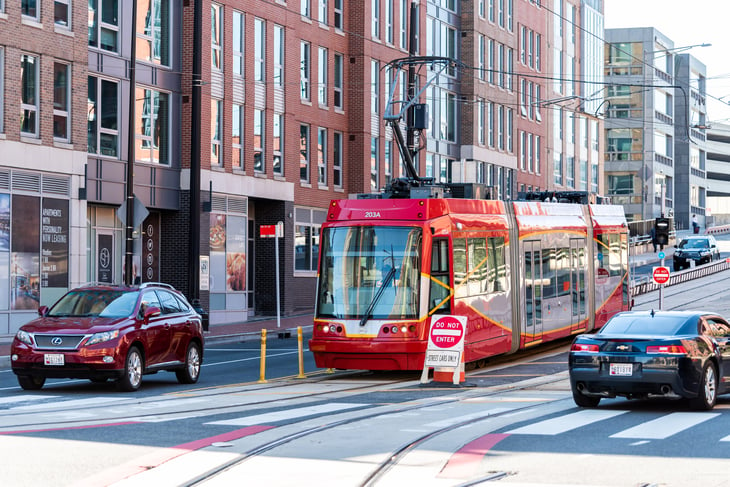
- Composite score: 95.9
- Annual public transit trips per resident: 22.2
- Share of workers who commute by public transit: 4.1%
- Share of stations that are ADA accessible: 93.8%
- Share of passenger miles traveled using electric power: 28.7%
Methodology

To determine the locations with the best public transportation, researchers at HireAHelper analyzed the latest data from the Federal Transit Administration’s 2021 National Transit Database and from the U.S. Census Bureau’s 2021 American Community Survey.
The researchers ranked metros according to a composite score based on the following factors and weights:
- Annual public transit trips per resident (25%)
- Share of workers who commute by public transit (20%)
- Average commute time difference (public transit versus private) (15%)
- Share of passenger miles traveled using electric power (15%)
- Mechanical failures (breakdowns) per passenger mile (10%)
- Share of stations that are ADA accessible (10%)
- Safety and security incidents per passenger mile (5%)
Only locations with complete data were included in the analysis. To improve relevance, only metropolitan areas with at least 100,000 people were included in the analysis.


Add a Comment
Our Policy: We welcome relevant and respectful comments in order to foster healthy and informative discussions. All other comments may be removed. Comments with links are automatically held for moderation.