


Editor's Note: This story originally appeared on Inspection Support Network.
Within the U.S., where people are living continues to shift over time.
Historically, the majority of the U.S. population was located in the Northeast and Midwest, but for the last 100 years, the share of Americans living in the South and especially the West has grown steadily.
The West’s share of the nation’s population first hit 10% in 1930 but now sits at 23.7%. Much of the South’s growth has taken place in the last half-century: from 1910 to 1970, the South’s share of the population hovered between 30% and 32%, but since then, the share of the population has grown to 38.1%.
With these trends, it is unsurprising to see that the West and South contain many of the states with the fastest rates of recent growth in the U.S.
In the last five years, parts of the Mountain West region have seen explosive population growth. The South is also home to a number of fast-growing states, led by Texas (5.8%) and Florida (5.7%).
At the local level, these regions are likewise well-represented among the list of fastest-growing cities.
Data on population for 2016 and 2021 as well as migration patterns across metropolitan areas are from the U.S. Census Bureau. To identify which locations are the fastest-growing, researchers at Inspection Support Network calculated the percentage change in total population between 2016 and 2021.
Researchers also calculated the most common origin for recent movers. All metropolitan areas from the U.S. Census with at least 100,000 people in 2021 were included in the analysis.
Here are the fastest-growing large metropolitan areas in the U.S.
15. Tampa-St. Petersburg-Clearwater, FL

- Percentage change in population (2016-2021): +5.6%
- Total change in population (2016-2021): +170,551
- Population 2021: 3,219,514
- Most common origin for recent movers: Miami-Fort Lauderdale-Pompano Beach, FL
14. Phoenix-Mesa-Chandler, AZ
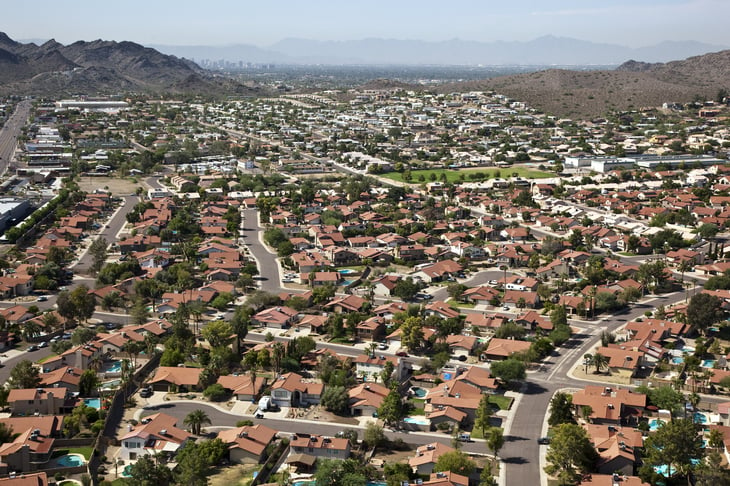
- Percentage change in population (2016-2021): +5.8%
- Total change in population (2016-2021): +272,809
- Population 2021: 4,946,145
- Most common origin for recent movers: Los Angeles-Long Beach-Anaheim, CA
13. Houston-The Woodlands-Sugar Land, TX

- Percentage change in population (2016-2021): +5.9%
- Total change in population (2016-2021): +400,338
- Population 2021: 7,206,841
- Most common origin for recent movers: Dallas-Fort Worth-Arlington, TX

12. Indianapolis-Carmel-Anderson, IN

- Percentage change in population (2016-2021): +6.0%
- Total change in population (2016-2021): +120,044
- Population 2021: 2,126,804
- Most common origin for recent movers: Chicago-Naperville-Elgin, IL-IN-WI
11. Atlanta-Sandy Springs-Alpharetta, GA

- Percentage change in population (2016-2021): +6.2%
- Total change in population (2016-2021): +356,085
- Population 2021: 6,144,050
- Most common origin for recent movers: New York-Newark-Jersey City, NY-NJ-PA
10. Salt Lake City, UT

- Percentage change in population (2016-2021): +6.6%
- Total change in population (2016-2021): +78,340
- Population 2021: 1,263,061
- Most common origin for recent movers: Provo-Orem, UT
9. Las Vegas-Henderson-Paradise, NV

- Percentage change in population (2016-2021): +7.2%
- Total change in population (2016-2021): +153,640
- Population 2021: 2,292,476
- Most common origin for recent movers: Los Angeles-Long Beach-Anaheim, CA
8. San Antonio-New Braunfels, TX

- Percentage change in population (2016-2021): +7.2%
- Total change in population (2016-2021): +175,512
- Population 2021: 2,601,788
- Most common origin for recent movers: Houston-The Woodlands-Sugar Land, TX
7. Dallas-Fort Worth-Arlington, TX

- Percentage change in population (2016-2021): +7.9%
- Total change in population (2016-2021): +564,857
- Population 2021: 7,759,615
- Most common origin for recent movers: Houston-The Woodlands-Sugar Land, TX
6. Charlotte-Concord-Gastonia, NC-SC

- Percentage change in population (2016-2021): +8.1%
- Total change in population (2016-2021): +201,349
- Population 2021: 2,701,046
- Most common origin for recent movers: New York-Newark-Jersey City, NY-NJ-PA
5. Nashville-Davidson–Murfreesboro–Franklin, TN

- Percentage change in population (2016-2021): +9.3%
- Total change in population (2016-2021): +171,182
- Population 2021: 2,012,476
- Most common origin for recent movers: Knoxville, TN
4. Orlando-Kissimmee-Sanford, FL

- Percentage change in population (2016-2021): +9.6%
- Total change in population (2016-2021): +236,342
- Population 2021: 2,691,925
- Most common origin for recent movers: Miami-Fort Lauderdale-Pompano Beach, FL
3. Jacksonville, FL

- Percentage change in population (2016-2021): +11.0%
- Total change in population (2016-2021): +161,643
- Population 2021: 1,637,666
- Most common origin for recent movers: Miami-Fort Lauderdale-Pompano Beach, FL
2. Raleigh-Cary, NC

- Percentage change in population (2016-2021): +11.1%
- Total change in population (2016-2021): +144,557
- Population 2021: 1,448,411
- Most common origin for recent movers: Durham-Chapel Hill, NC
1. Austin-Round Rock, TX

- Percentage change in population (2016-2021): +14.1%
- Total change in population (2016-2021): +290,410
- Population 2021: 2,352,426
- Most common origin for recent movers: Houston-The Woodlands-Sugar Land, TX
Methodology

Data on population for 2016 and 2021 as well as migration patterns across metropolitan areas are from the U.S. Census Bureau. To identify which locations are the fastest growing, researchers at Inspection Support Network calculated the percentage change in population between 2016 and 2021.
The most common origin for recent movers is the metropolitan area or state with the largest absolute number of movers using the most recent migration data available, which covers the period 2015–2019.
All metropolitan areas from the U.S. Census with at least 100,000 people were included in the analysis.
Add a Comment
Our Policy: We welcome relevant and respectful comments in order to foster healthy and informative discussions. All other comments may be removed. Comments with links are automatically held for moderation.