This story originally appeared on Self Financial.
The COVID-19 pandemic has created deep financial hardships for millions of American families. Amid record job losses, reduced hours and wage cuts, the large share of U.S. workers who were already living paycheck to paycheck are now struggling even more to cover basic expenses.
New data from the Fed’s Report on the Economic Well-Being of U.S. Households shows that prior to the pandemic, less than half of Americans had enough savings to afford three months of expenses. And a staggering 37% of Americans reported that they would be unable to cover a $400 emergency expense without assistance.
Americans under 40 today have also accumulated less wealth than their parents did when they were the same age.
To find the best metropolitan areas for saving money, researchers at Self Financial analyzed the latest data from the U.S. Census Bureau’s American Community Survey (ACS), the Bureau of Economic Analysis’s (BEA) Real Personal Income, Zillow’s Zillow Home Price Index (ZHVI), and the Department of Housing and Urban Development (HUD) Fair Market Rents.
For additional context, researchers also calculated the median home price and the fair market rent for a two-bedroom apartment.
The researchers ranked metro areas according to a composite score based on three factors:
- Real per-capita personal income (45 points)
- Median housing costs as a percentage of median household income (35 points)
- Historical unemployment rate (20 points)
Here are the best large metropolitan areas for saving money.
15. Oklahoma City

Composite score: 83.20
Real per-capita personal income: $49,904
Median housing costs as a percentage of household income: 19.1%
Historical unemployment rate: below average
Median home price: $152,392
Fair market rent (2-bedroom): $906
14. Cleveland-Elyria, Ohio

Composite score: 83.21
Real per-capita personal income: $55,623
Median housing costs as a percentage of household income: 19.2%
Historical unemployment rate: above average
Median home price: $155,360
Fair market rent (2-bedroom): $849
13. Denver-Aurora-Lakewood, Colorado

Composite score: 83.27
Real per-capita personal income: $57,109
Median housing costs as a percentage of household income: 22.3%
Historical unemployment rate: significantly below average
Median home price: $436,125
Fair market rent (2-bedroom): $1,566
12. Columbus, Ohio

Composite score: 83.53
Real per-capita personal income: $51,871
Median housing costs as a percentage of household income: 19.7%
Historical unemployment rate: below average
Median home price: $206,311
Fair market rent (2-bedroom): $992
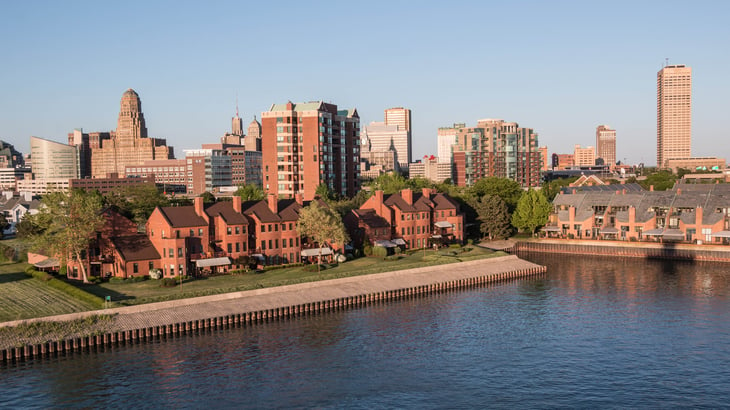
11. Buffalo-Cheektowaga-Niagara Falls, New York

Composite score: 84.44
Real per-capita personal income: $49,571
Median housing costs as a percentage of household income: 18.5%
Historical unemployment rate: below average
Median home price: $170,794
Fair market rent (2-bedroom): $843
10. Milwaukee-Waukesha-West Allis, Wisconsin

Composite score: 85.19
Real per-capita personal income: $56,024
Median housing costs as a percentage of household income: 20.2%
Historical unemployment rate: below average
Median home price: $203,884
Fair market rent (2-bedroom): $922
9. Nashville-Davidson-Murfreesboro-Franklin, Tennessee

Composite score: 86.58
Real per-capita personal income: $56,194
Median housing costs as a percentage of household income: 20.2%
Historical unemployment rate: below average
Median home price: $276,110
Fair market rent (2-bedroom): $1,136
8. Indianapolis-Carmel-Anderson, Indiana

Composite score: 87.41
Real per-capita personal income: $55,127
Median housing costs as a percentage of household income: 19.1%
Historical unemployment rate: below average
Median home price: $176,777
Fair market rent (2-bedroom): $946
7. Kansas City, Missouri-Kansas

Composite score: 87.48
Real per-capita personal income: $53,984
Median housing costs as a percentage of household income: 19.2%
Historical unemployment rate: below average
Median home price: $201,600
Fair market rent (2-bedroom): $978
6. Raleigh, North Carolina

Composite score: 88.26
Real per-capita personal income: $53,095
Median housing costs as a percentage of household income: 18.9%
Historical unemployment rate: below average
Median home price: $281,174
Fair market rent (2-bedroom): $1,163
5. St. Louis-East St. Louis, Missouri-Illinois

Composite score: 88.97
Real per-capita personal income: $57,243
Median housing costs as a percentage of household income: 18.7%
Historical unemployment rate: below average
Median home price: $177,745
Fair market rent (2-bedroom): $905
4. Cincinnati, Ohio-Kentucky-Indiana

Composite score: 89.83
Real per-capita personal income: $56,678
Median housing costs as a percentage of household income: 18.7%
Historical unemployment rate: below average
Median home price: $182,045
Fair market rent (2-bedroom): $865
3. Grand Rapids-Wyoming, Michigan

Composite score: 89.89
Real per-capita personal income: $51,161
Median housing costs as a percentage of household income: 17.7%
Historical unemployment rate: below average
Median home price: $215,184
Fair market rent (2-bedroom): $962
2. Minneapolis-St. Paul-Bloomington, Minnesota-Wisconsin

Composite score: 90.07
Real per-capita personal income: $56,886
Median housing costs as a percentage of household income: 19.2%
Historical unemployment rate: significantly below average
Median home price: $289,170
Fair market rent (2-bedroom): $1,214
1. Pittsburgh, Pennsylvania

Composite score: 92.84
Real per-capita personal income: $58,117
Median housing costs as a percentage of household income: 17.6%
Historical unemployment rate: below average
Median home price: $156,026
Fair market rent (2-bedroom): $890


Add a Comment
Our Policy: We welcome relevant and respectful comments in order to foster healthy and informative discussions. All other comments may be removed. Comments with links are automatically held for moderation.