Editor's Note: This story originally appeared on Stessa.
The U.S. economy has made a remarkable comeback from the deep dive last year caused by the coronavirus pandemic.
Consumer spending (fueled by personal savings and government stimulus money) is strong, the economy recently added the most jobs in nearly a year, and the housing market is booming.
According to the Bureau of Labor Statistics, nonfarm employment has grown by 1.5% from January to May, and the unemployment rate is now 5.9%, well below the high of 14.8% seen in April 2020.
In the spring of last year, real gross domestic product (GDP) — a measure of economic activity used to track the health of the country — fell by a record annualized rate of 31.4%, the sharpest contraction in modern U.S. history. In comparison, real GDP fell by less than 9% annualized in 2008 during the Great Recession and took several years to recover.
Following the initial COVID-19 shutdowns, GDP has been recovering quickly as economic activity resumes, and is projected to return to its pre-pandemic level later this year.
To find the locations with the most economic growth in 2021, researchers at Stessa analyzed data from the Bureau of Labor Statistics, the U.S. Census Bureau, and Redfin, creating a composite score based on the following factors:
- Percentage change in total employment from January to May 2021
- Unemployment rate from May 2021
- Average monthly building permits per capita (averaged over January to May 2021)
- Average monthly home sales per capita (averaged over January to May 2021)
Stessa ranked metros using the same composite score. To improve relevance, only metropolitan areas with at least 100,000 residents were included in the analysis. Additionally, metro areas were grouped based on population size.
Here are the large U.S. metros (those with populations of 1 million or more) experiencing the most economic growth in 2021.
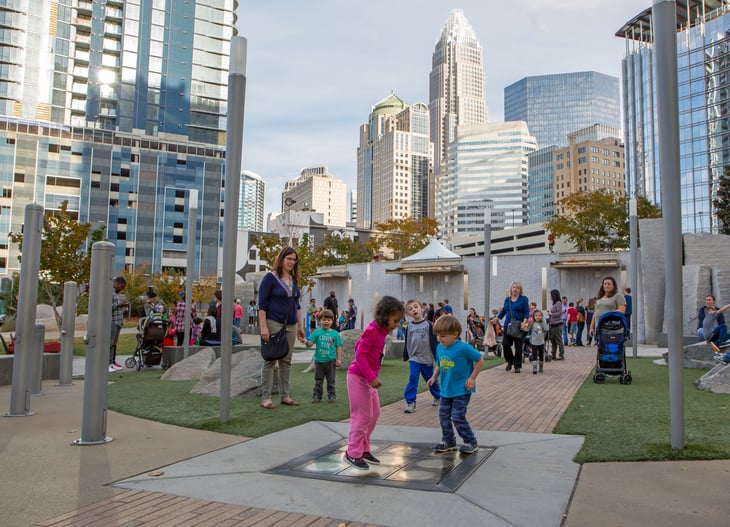
15. Charlotte-Concord-Gastonia, NC-SC

Composite score: 63.6
Percentage change in total employment: 0.4%
Unemployment rate: 4.3%
Average monthly building permits per 100,000 residents: 83
Average monthly home sales per 100,000 residents: 152
Population: 2,636,883
14. Phoenix-Mesa-Chandler, AZ

Composite score: 64.4
Percentage change in total employment: 1.3%
Unemployment rate: 6.2%
Average monthly building permits per 100,000 residents: 88
Average monthly home sales per 100,000 residents: 173
Population: 4,948,203
13. Portland-Vancouver-Hillsboro, OR-WA

Composite score: 64.6
Percentage change in total employment: 2.6%
Unemployment rate: 5.3%
Average monthly building permits per 100,000 residents: 51
Average monthly home sales per 100,000 residents: 133
Population: 2,493,221
12. Las Vegas-Henderson-Paradise, NV

Composite score: 64.7
Percentage change in total employment: 3.1%
Unemployment rate: 8.9%
Average monthly building permits per 100,000 residents: 63
Average monthly home sales per 100,000 residents: 181
Population: 2,266,715
11. Denver-Aurora-Lakewood, CO

Composite score: 65.3
Percentage change in total employment: 1.6%
Unemployment rate: 5.9%
Average monthly building permits per 100,000 residents: 77
Average monthly home sales per 100,000 residents: 156
Population: 2,967,239
10. Atlanta-Sandy Springs-Alpharetta, GA

Composite score: 68.9
Percentage change in total employment: 1.1%
Unemployment rate: 3.9%
Average monthly building permits per 100,000 residents: 55
Average monthly home sales per 100,000 residents: 153
Population: 6,018,744
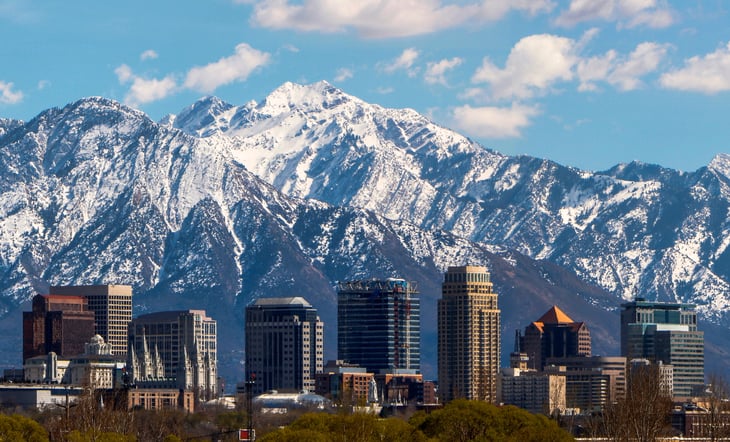
9. Salt Lake City, UT

Composite score: 69.9
Percentage change in total employment: 1.1%
Unemployment rate: 2.8%
Average monthly building permits per 100,000 residents: 78
Average monthly home sales per 100,000 residents: 107
Population: 1,232,696
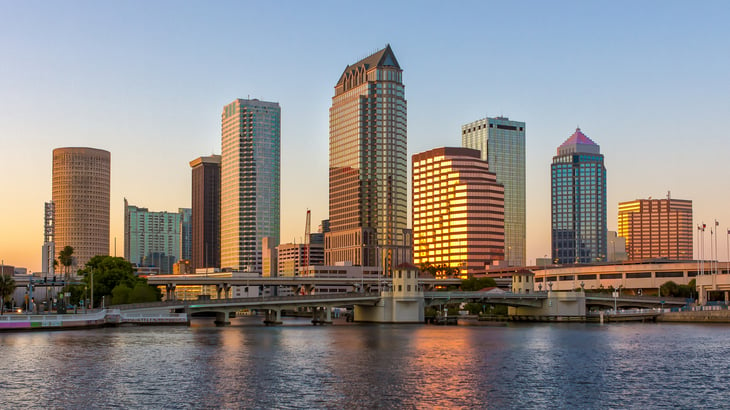
8. Tampa-St. Petersburg-Clearwater, FL

Composite score: 70.4
Percentage change in total employment: 1.0%
Unemployment rate: 4.6%
Average monthly building permits per 100,000 residents: 75
Average monthly home sales per 100,000 residents: 193
Population: 3,194,831
7. Minneapolis-St. Paul-Bloomington, MN-WI

Composite score: 71.4
Percentage change in total employment: 1.7%
Unemployment rate: 3.8%
Average monthly building permits per 100,000 residents: 57
Average monthly home sales per 100,000 residents: 122
Population: 3,640,043
6. Oklahoma City, OK

Composite score: 73.0
Percentage change in total employment: 1.3%
Unemployment rate: 3.6%
Average monthly building permits per 100,000 residents: 55
Average monthly home sales per 100,000 residents: 139
Population: 1,408,950
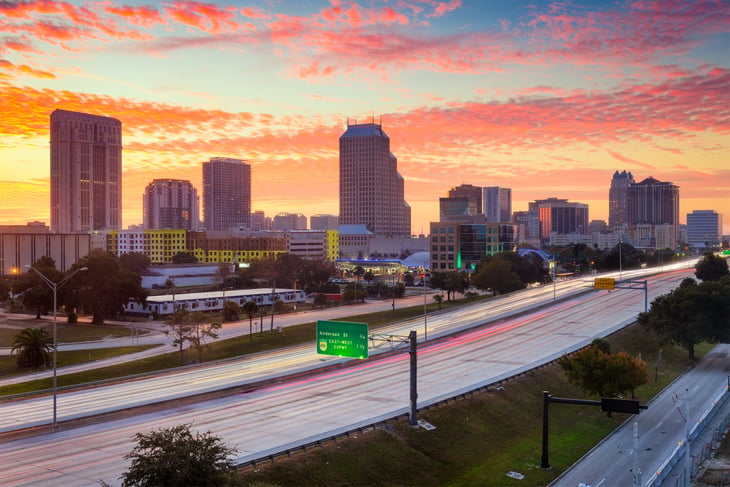
5. Orlando-Kissimmee-Sanford, FL

Composite score: 74.7
Percentage change in total employment: 2.8%
Unemployment rate: 5.4%
Average monthly building permits per 100,000 residents: 84
Average monthly home sales per 100,000 residents: 173
Population: 2,608,147
4. Jacksonville, FL

Composite score: 75.0
Percentage change in total employment: 0.8%
Unemployment rate: 4.2%
Average monthly building permits per 100,000 residents: 127
Average monthly home sales per 100,000 residents: 191
Population: 1,559,514
3. Austin-Round Rock-Georgetown, TX

Composite score: 77.9
Percentage change in total employment: 1.3%
Unemployment rate: 4.2%
Average monthly building permits per 100,000 residents: 207
Average monthly home sales per 100,000 residents: 138
Population: 2,227,083
2.Raleigh-Cary, NC

Composite score: 78.6
Percentage change in total employment: 1.0%
Unemployment rate: 3.8%
Average monthly building permits per 100,000 residents: 136
Average monthly home sales per 100,000 residents: 168
Population: 1,390,785
1. Nashville-Davidson–Murfreesboro–Franklin, TN

Composite score: 78.9
Percentage change in total employment: 1.1%
Unemployment rate: 3.9%
Average monthly building permits per 100,000 residents: 132
Average monthly home sales per 100,000 residents: 174
Population: 1,933,860
Detailed Findings & Methodology

The metropolitan areas with the most economic growth in 2021 are scattered across the South, Southeast, and West. These metros have fared well in their economic recovery from the pandemic, with good employment growth, low unemployment rates, and strong housing markets.
One of the hardest-hit metro areas in the U.S. during the pandemic, Las Vegas, had the highest employment growth from January to May, at 3.1%. Florida is home to a number of large metros in the top 15, due to brisk home sales and lower than average unemployment rates.
A significant number of small and midsize metros with the most economic growth in 2021 are located in Florida and Utah. The Naples-Marco Island, Florida, metro area had an average of 462 monthly home sales per 100,000 residents in the first five months of 2021, nearly three times the national average.
New home construction is also booming in many of these areas — the metro of North Port-Sarasota-Bradenton, Florida, had an average of 159 monthly building permits per 100,000 residents, 3.7 times the national average of 43.
To find the locations with the most economic growth in 2021, researchers at Stessa analyzed data from the Bureau of Labor Statistics, the U.S. Census Bureau, and Redfin, creating a composite score based on the following factors:
- Percentage change in total employment from January to May 2021
- Unemployment rate from May 2021
- Average monthly building permits per capita (averaged over January to May 2021)
- Average monthly home sales per capita (averaged over January to May 2021)
Only locations with available data across all metrics were included. Metro areas and states were ranked according to their composite score. In the event of a tie, the location with the larger percentage change in total employment was ranked higher.


Add a Comment
Our Policy: We welcome relevant and respectful comments in order to foster healthy and informative discussions. All other comments may be removed. Comments with links are automatically held for moderation.