


Editor's Note: This story originally appeared on Construction Coverage.
As home prices continue to climb across the United States, housing affordability remains a critical concern for both prospective buyers and policymakers.
Over the past decade, persistent price growth — driven by limited supply, strong demand, and rising construction costs — has reshaped access to homeownership nationwide.
Recent data from the National Association of Realtors shows that while inventory has improved modestly, middle-income households still face significant gaps in affordability.
As of early 2025, buyers earning around $75,000 annually could afford just 21% of listings — less than half the share available to them before the pandemic.
These conditions highlight the ongoing pressure to expand the supply of affordable homes.
This analysis from Construction Coverage draws on data from the U.S. Census Bureau and Zillow to examine where new housing is being developed most affordably. Find out more about the methodology at the end.
Here are the major metro areas investing in more affordable housing.
15. Louisville/Jefferson County, KY-IN
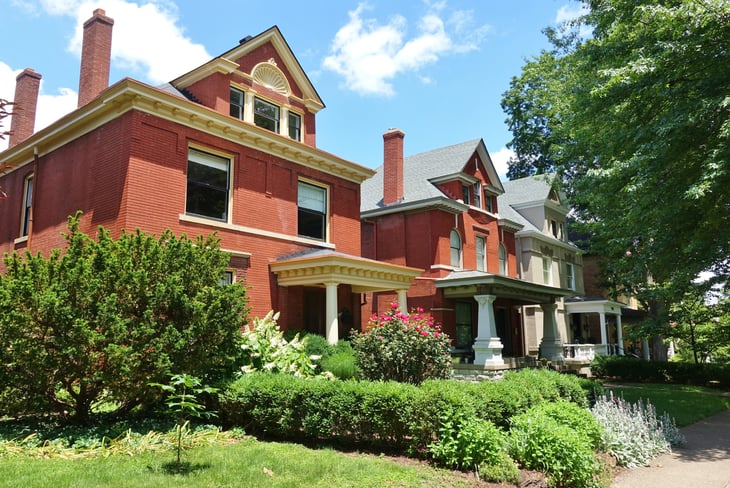
- Average value per new housing unit authorized: $239,690
- Total new housing units authorized: 5,796
- Total value of new housing units authorized: $1,389,244,000
- Median home price: $272,138
- Share of new units that are multi-family: 36.3%
14. Washington-Arlington-Alexandria, DC-VA-MD-WV

- Average value per new housing unit authorized: $239,667
- Total new housing units authorized: 21,487
- Total value of new housing units authorized: $5,149,716,000
- Median home price: $587,158
- Share of new units that are multi-family: 45.3%
13. Tulsa, OK

- Average value per new housing unit authorized: $236,719
- Total new housing units authorized: 4,311
- Total value of new housing units authorized: $1,020,494,000
- Median home price: $246,962
- Share of new units that are multi-family: 16.4%
12. Atlanta-Sandy Springs-Roswell, GA
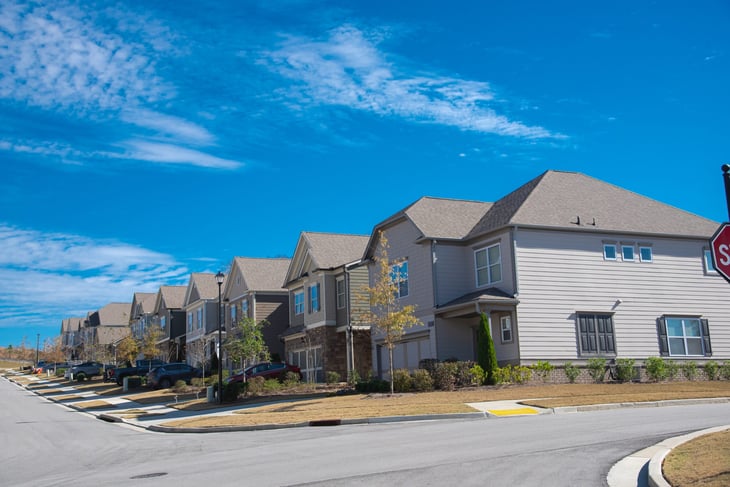
- Average value per new housing unit authorized: $235,411
- Total new housing units authorized: 40,687
- Total value of new housing units authorized: $9,578,165,000
- Median home price: $388,897
- Share of new units that are multi-family: 36.7%
11. Baltimore-Columbia-Towson, MD
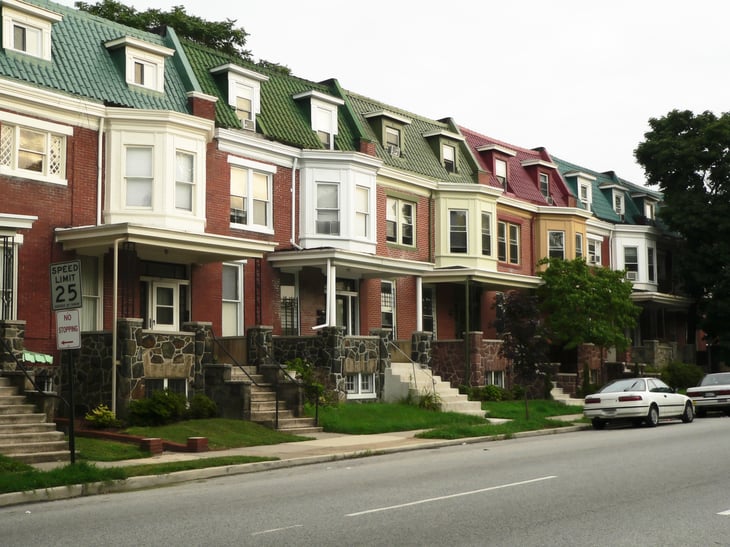
- Average value per new housing unit authorized: $234,694
- Total new housing units authorized: 6,284
- Total value of new housing units authorized: $1,474,816,000
- Median home price: $403,428
- Share of new units that are multi-family: 38.7%
10. San Diego-Chula Vista-Carlsbad, CA

- Average value per new housing unit authorized: $231,115
- Total new housing units authorized: 11,572
- Total value of new housing units authorized: $2,674,464,000
- Median home price: $941,517
- Share of new units that are multi-family: 70.8%
9. Providence-Warwick, RI-MA
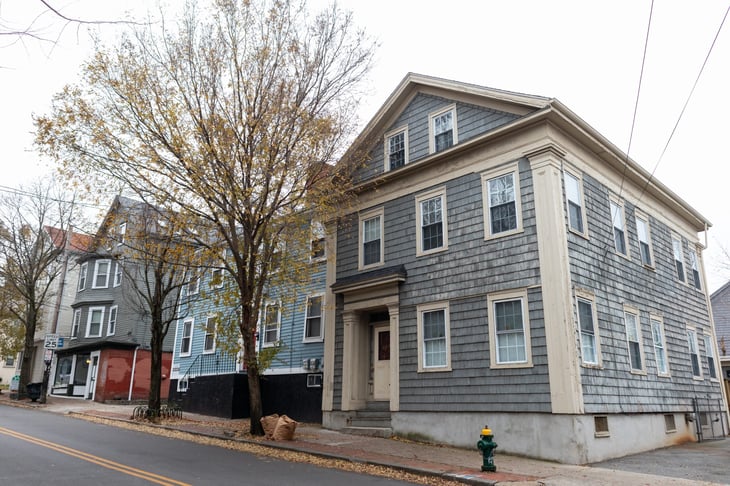
- Average value per new housing unit authorized: $227,784
- Total new housing units authorized: 2,620
- Total value of new housing units authorized: $596,793,000
- Median home price: $510,437
- Share of new units that are multi-family: 48.9%
8. Memphis, TN-MS-AR
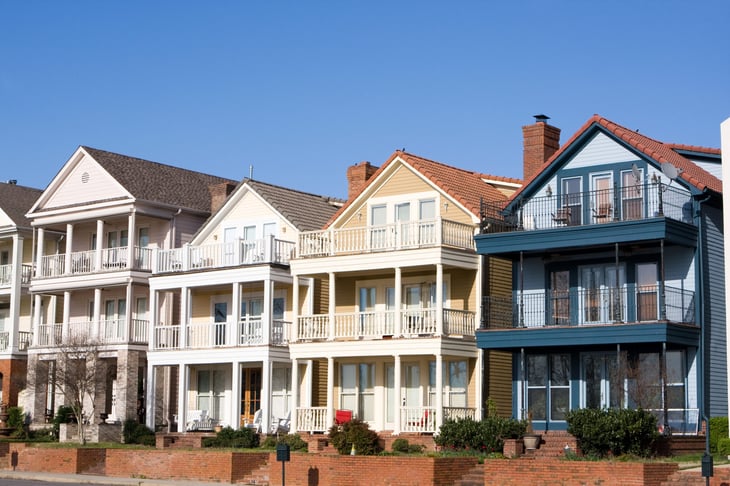
- Average value per new housing unit authorized: $216,031
- Total new housing units authorized: 4,240
- Total value of new housing units authorized: $915,972,000
- Median home price: $245,630
- Share of new units that are multi-family: 34.6%
7. Austin-Round Rock-San Marcos, TX
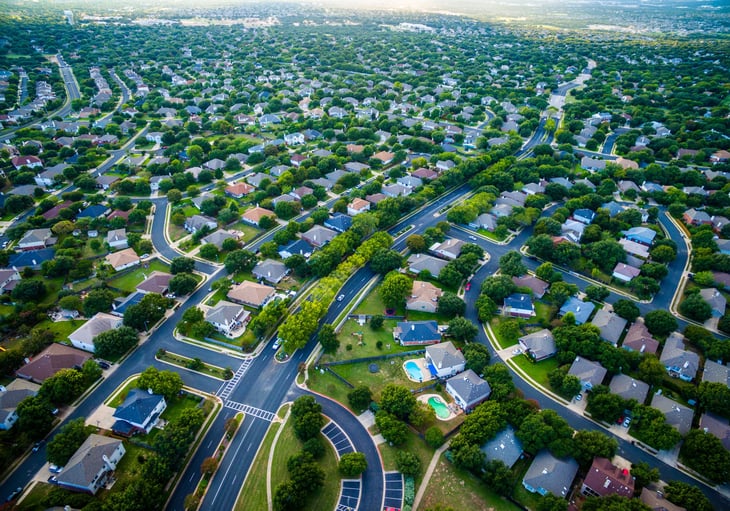
- Average value per new housing unit authorized: $214,844
- Total new housing units authorized: 32,294
- Total value of new housing units authorized: $6,938,188,000
- Median home price: $449,110
- Share of new units that are multi-family: 49.1%

6. Los Angeles-Long Beach-Anaheim, CA
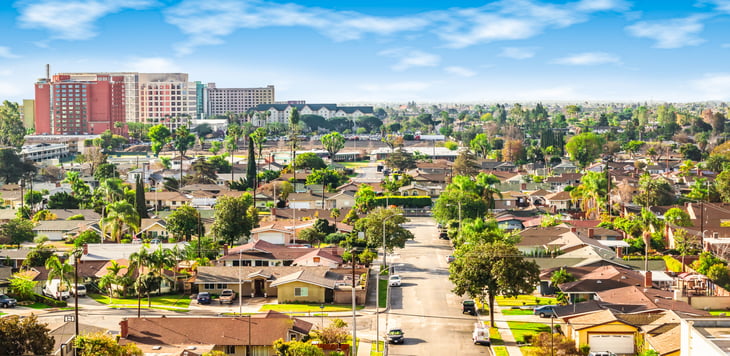
- Average value per new housing unit authorized: $210,125
- Total new housing units authorized: 26,781
- Total value of new housing units authorized: $5,627,354,000
- Median home price: $972,837
- Share of new units that are multi-family: 56.0%
5. Philadelphia-Camden-Wilmington, PA-NJ-DE-MD

- Average value per new housing unit authorized: $207,695
- Total new housing units authorized: 14,214
- Total value of new housing units authorized: $2,952,174,000
- Median home price: $385,435
- Share of new units that are multi-family: 41.4%
4. Hartford-West Hartford-East Hartford, CT

- Average value per new housing unit authorized: $200,106
- Total new housing units authorized: 1,887
- Total value of new housing units authorized: $377,600,000
- Median home price: $388,982
- Share of new units that are multi-family: 66.0%
3. New York-Newark-Jersey City, NY-NJ
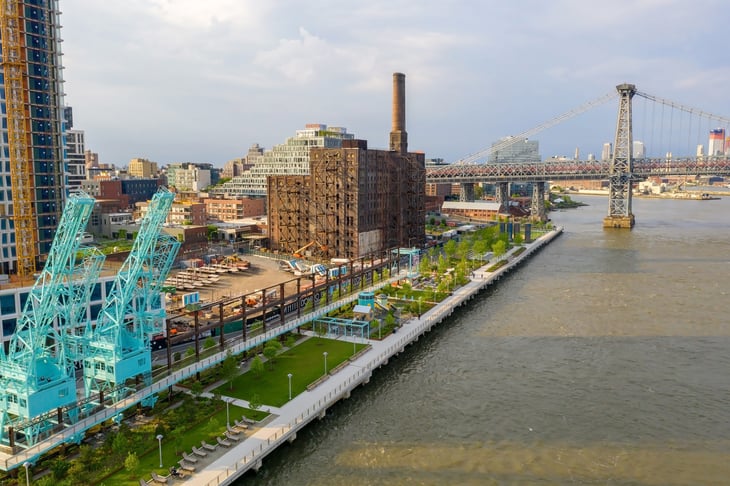
- Average value per new housing unit authorized: $182,378
- Total new housing units authorized: 57,929
- Total value of new housing units authorized: $10,564,952,000
- Median home price: $712,843
- Share of new units that are multi-family: 78.4%
2. Richmond, VA

- Average value per new housing unit authorized: $180,794
- Total new housing units authorized: 8,642
- Total value of new housing units authorized: $1,562,426,000
- Median home price: $388,515
- Share of new units that are multi-family: 41.9%
1. Omaha, NE-IA
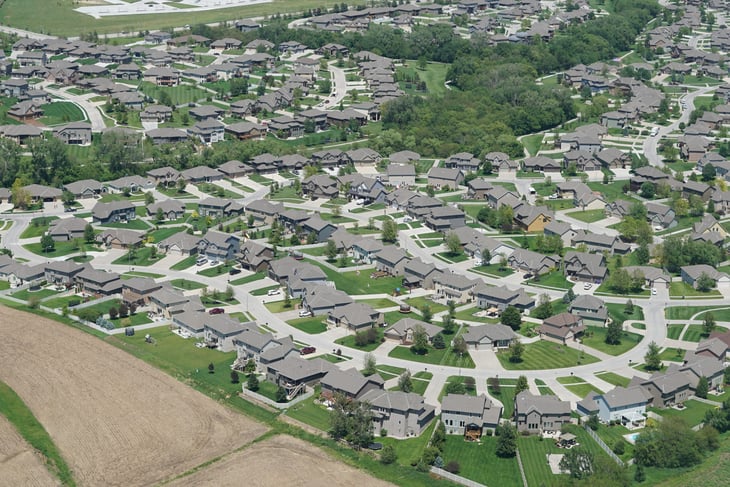
- Average value per new housing unit authorized: $172,691
- Total new housing units authorized: 7,197
- Total value of new housing units authorized: $1,242,857,000
- Median home price: $304,161
- Share of new units that are multi-family: 51.3%
Methodology

This analysis draws on data from the U.S. Census Bureau’s 2024 Building Permits Survey, which tracks authorizations for new residential construction, and the Zillow Home Value Index (ZHVI), a measure of typical home value in local markets.
The primary metric used to assess affordable housing investment is the average construction value per new housing unit authorized in 2024. This figure reflects the estimated cost of the structure itself and excludes land value.
Additional metrics include the total number and value of new housing units authorized, the share of units classified as multi-family, and the median home price in each location across both new and existing homes.

Add a Comment