


Editor's Note: This story originally appeared on Porch.
While the red-hot real estate market has shown some recent signs of cooling in the transition to the traditionally slower fall and winter seasons, the market remains highly competitive for homebuyers.
Throughout 2020 and 2021, the market has seen steep increases in home prices as a growing number of buyers compete for a limited inventory of homes. These conditions have required bidders to be aggressive in their offers to beat out competitors, often offering amounts significantly above sellers’ asking price. The median sales price of U.S. homes has risen by more than 20% since last summer, setting historic records and topping $400,000 for the first time earlier this year.
And the conditions contributing to this competitive environment show little sign of slowing down. One of the major issues is a constraint on supply. Fewer sellers listed their homes during early months of the pandemic, which sent inventory to record lows late in 2020. Even after the supply of existing homes returned to pre-pandemic levels, new construction has struggled to keep up with demand due to builders’ difficulties securing materials and labor. And these recent conditions do not even reflect the fact that the U.S. already had a severe shortage of homes prior to the pandemic, according to statistics from Freddie Mac.
Seasonality in the market has finally slowed the upward trajectory of prices, but the share of homes selling above asking price is still well above historic levels. In most years before the pandemic, the percentage of homes selling above asking hovered around 20% during off-peak times and around 25% during the busy summer season. In 2020 and 2021, however, the share has remained much higher than usual, peaking at 56.4% in June 2021. The average sale-to-list percentage has paralleled these trends, with the ratio nationally holding above 100% for most of 2021.
Large Metros Where the Most Homes Sold Above Asking

The hot real estate market is a nationwide phenomenon, but some locations are especially competitive and more likely to see sales prices exceed the asking price. In these locations, the demand issue may be felt more strongly as economic growth or migration bring more buyers into the market, while supply constraints may be worsened by land availability and regulations on zoning and development that make it harder to build. Five states — Massachusetts, Colorado, California, New Hampshire, and Washington — have more than 60% of homes selling above asking price in 2021, and most other leading states are found on the coasts. In contrast, states in the central and southern U.S. tend to have a much lower percentage.
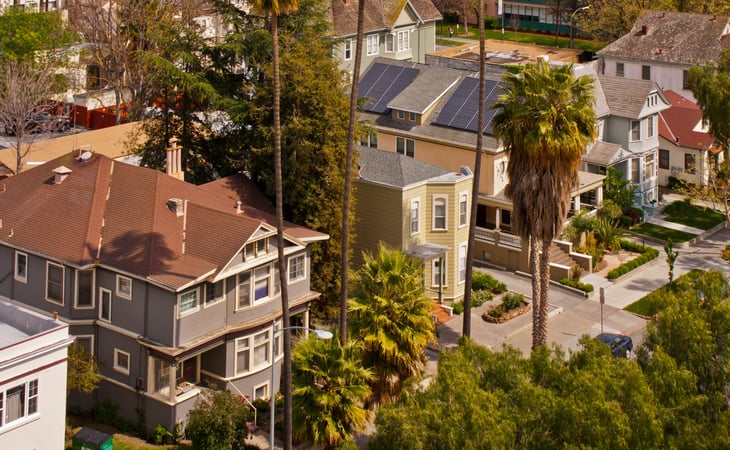
Similar patterns hold at the metro level. Many of the cities where homes are selling at high prices are found in locations where housing is in high demand. Unsurprisingly, the top three large metros where homes are selling above asking are all found in California, which has some of the greatest challenges with housing of any state.
The data used in this analysis is from Redfin and the U.S. Census Bureau. To determine the locations where the most homes are selling above asking price, researchers at Porch calculated the percentage of homes that sold above asking between January 2021 and September 2021. In the event of a tie, the location with the greater average sale-to-list percentage was ranked higher. To improve relevance, only metropolitan areas with at least 100,000 residents and available data from Redfin were included.
Here are the metros where the most homes sold above asking price in 2021.
15. Minneapolis-St. Paul-Bloomington, MN-WI
- Percentage of homes that sold above asking: 59.6%
- Average sale-to-list percentage: 102.8%
- Median days on market: 16
- Median sale price: $340,585
14. Richmond, VA
- Percentage of homes that sold above asking: 60.8%
- Average sale-to-list percentage: 102.8%
- Median days on market: 9
- Median sale price: $312,114
13. Riverside-San Bernardino-Ontario, CA
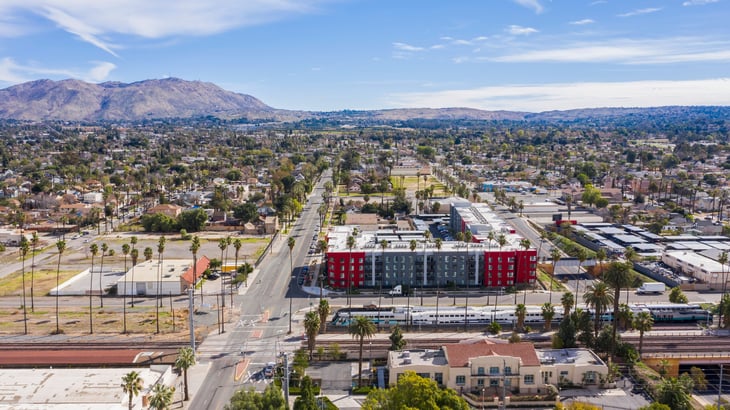
- Percentage of homes that sold above asking: 61.1%
- Average sale-to-list percentage: 102.2%
- Median days on market: 28
- Median sale price: $491,650
12. Portland-Vancouver-Hillsboro, OR-WA
- Percentage of homes that sold above asking: 61.1%
- Average sale-to-list percentage: 103.2%
- Median days on market: 7
- Median sale price: $497,534
11. Providence-Warwick, RI-MA
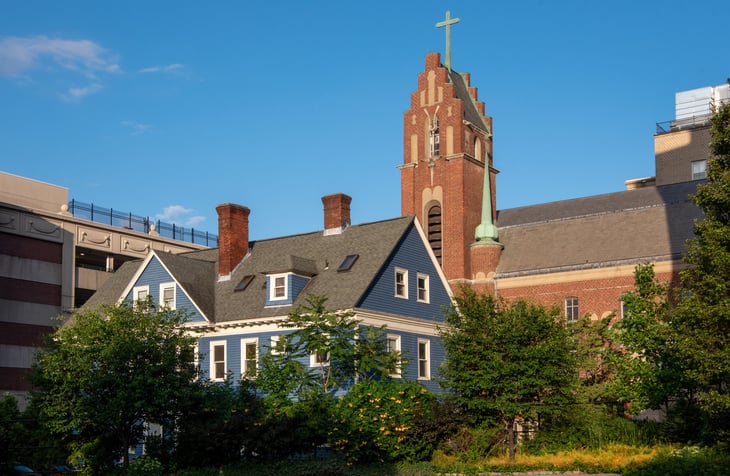
- Percentage of homes that sold above asking: 61.3%
- Average sale-to-list percentage: 102.4%
- Median days on market: 25
- Median sale price: $363,560
10. Boston-Cambridge-Newton, MA-NH
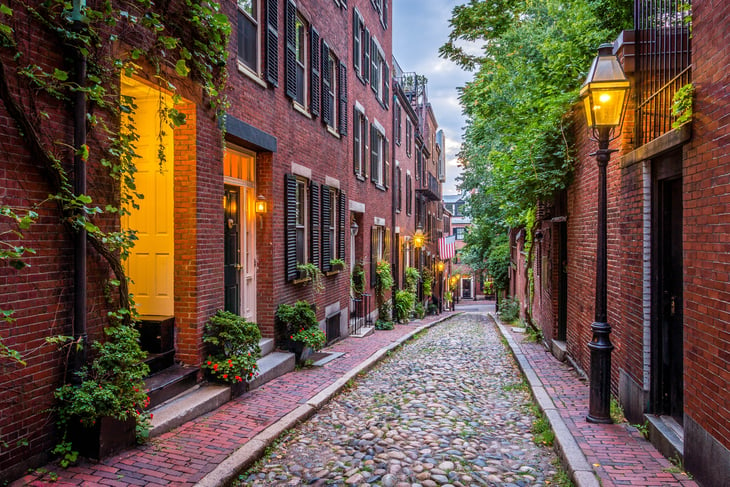
- Percentage of homes that sold above asking: 62.1%
- Average sale-to-list percentage: 103.3%
- Median days on market: 20
- Median sale price: $589,762
9. Seattle-Tacoma-Bellevue, WA

- Percentage of homes that sold above asking: 63.3%
- Average sale-to-list percentage: 105.3%
- Median days on market: 6
- Median sale price: $660,383
8. Buffalo-Cheektowaga, NY
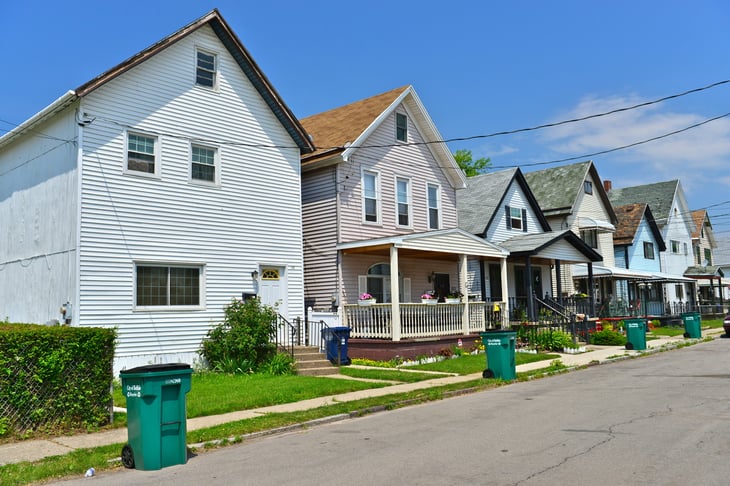
- Percentage of homes that sold above asking: 63.8%
- Average sale-to-list percentage: 105.9%
- Median days on market: 11
- Median sale price: $201,151
7. Salt Lake City, UT

- Percentage of homes that sold above asking: 63.9%
- Average sale-to-list percentage: 102.9%
- Median days on market: 10
- Median sale price: $454,033
6. Austin-Round Rock-Georgetown, TX
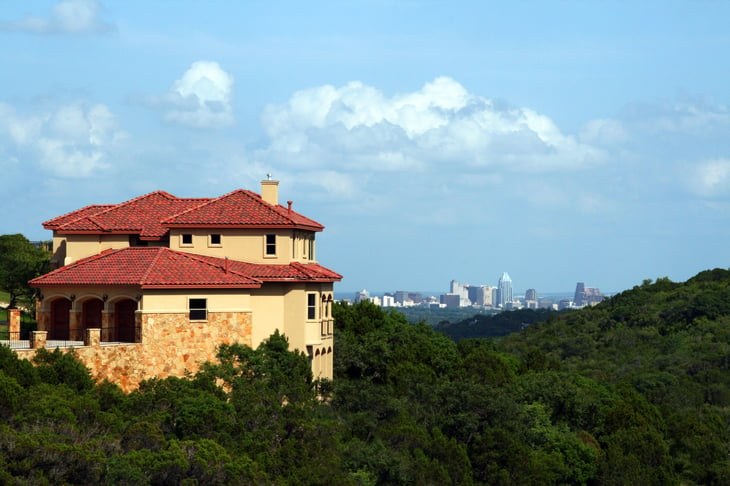
- Percentage of homes that sold above asking: 64.1%
- Average sale-to-list percentage: 106.2%
- Median days on market: 29
- Median sale price: $452,792
5. Denver-Aurora-Lakewood, CO

- Percentage of homes that sold above asking: 65.0%
- Average sale-to-list percentage: 103.5%
- Median days on market: 6
- Median sale price: $519,201
4. Rochester, NY
- Percentage of homes that sold above asking: 67.8%
- Average sale-to-list percentage: 107.1%
- Median days on market: 9
- Median sale price: $186,704
3. Sacramento-Roseville-Folsom, CA

- Percentage of homes that sold above asking: 68.3%
- Average sale-to-list percentage: 103.3%
- Median days on market: 8
- Median sale price: $535,494
2. San Francisco-Oakland-Berkeley, CA

- Percentage of homes that sold above asking: 74.6%
- Average sale-to-list percentage: 108.1%
- Median days on market: 13
- Median sale price: $1,127,851
1. San Jose-Sunnyvale-Santa Clara, CA
- Percentage of homes that sold above asking: 75.7%
- Average sale-to-list percentage: 106.6%
- Median days on market: 13
- Median sale price: $1,336,043
Detailed Findings & Methodology
The data used in this analysis is from Redfin’s Data Center and the U.S. Census Bureau’s 2020 Population Estimates. To determine the locations where the most homes are selling above asking price, researchers calculated the percentage of homes that sold above asking between January 2021 and September 2021. In the event of a tie, the location with the greater average sale-to-list percentage was ranked higher.
All the fields were determined using a weighted average of the monthly data based on the number of homes sold for the specific location and time period. To improve relevance, only metropolitan areas with at least 100,000 residents were included. Additionally, metros were grouped into cohorts based on population size: small (100,000–349,999), midsize (350,000–999,999), and large (1,000,000 or more). Note, only metropolitan statistical areas and states with complete data from Redfin were included.
Add a Comment
Our Policy: We welcome relevant and respectful comments in order to foster healthy and informative discussions. All other comments may be removed. Comments with links are automatically held for moderation.