


Editor's Note: This story originally appeared on Construction Coverage.
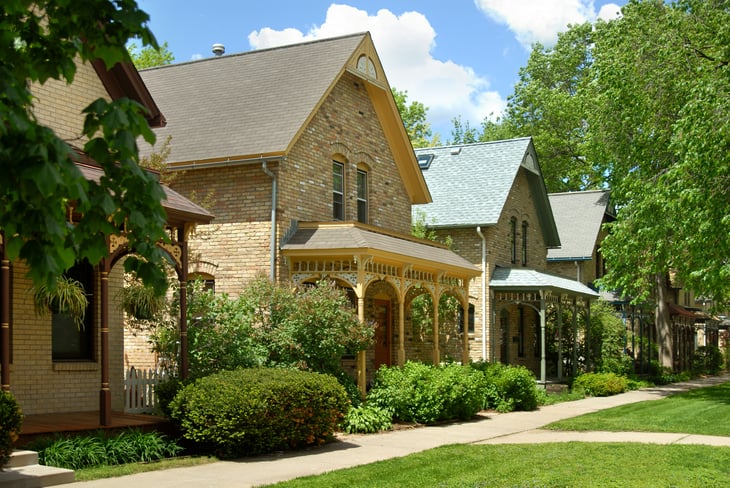
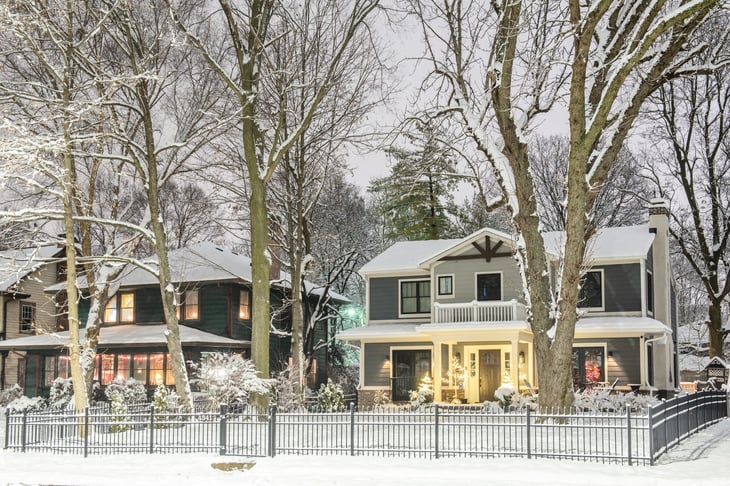
After a two-year frenzy during the COVID-19 pandemic, the residential real estate market has begun to show signs of slowing down this spring and summer. Mortgage rates are on the rise, and applications for home loans are down year over year. Housing inventory for sale is increasing, and sellers are showing more willingness to lower their asking prices.
While there are recent signs that the market is balancing out, the last two years brought unprecedented growth in home values, to the benefit of current owners and homebuilders. With low interest rates, homebuyers were able to borrow more money and pay more for homes. This sent prices to record levels. And with values rising quickly, builders have rushed to build housing: the number of units currently under construction is at its highest level since the 1970s.
The value of new residential units had already been on a steady upward trajectory since the collapse of the housing bubble and the ensuing Great Recession in the mid-2000s. After bottoming out at around $95 billion in 2009, the annual value of new housing units nearly tripled over the next decade to $280 billion in 2019. But this growth accelerated even further during the COVID-19 pandemic, with new units valued at $307 billion in 2020 and leaping to $380 billion last year.
While interest rate hikes are likely to cool demand and slow the pace of home price increases, the Fed’s recent moves cannot solve the housing market’s more fundamental supply challenges. According to researchers at Freddie Mac, the U.S. had a 3.8 million-unit deficit in housing supply in 2020. And with labor shortages and increased material costs during the pandemic, new construction projects may take longer or cost more to complete.
To determine the metros with the biggest increases in home construction, researchers at Construction Coverage analyzed the latest data from the U.S. Census Bureau’s Building Permits Survey. The researchers ranked metro areas according to the value of residential housing permits authorized from January through April of 2022 compared to the same period in 2021.
Here are the U.S. metros with the biggest increase in home construction.
15. Richmond, VA
- Percentage increase in value of new residential housing units: +15.3%
- Total increase in value of new residential housing units: $82,553,000
- Percentage increase in new residential housing units: +29.2%
- Total increase in new residential housing units: +889
14. Tucson, AZ
- Percentage increase in value of new residential housing units: +15.9%
- Total increase in value of new residential housing units: $94,136,000
- Percentage increase in new residential housing units: +22.6%
- Total increase in new residential housing units: +477
13. Denver-Aurora-Lakewood, CO

- Percentage increase in value of new residential housing units: +18.2%
- Total increase in value of new residential housing units: $326,017,000
- Percentage increase in new residential housing units: +2.3%
- Total increase in new residential housing units: +208
12. Charlotte-Concord-Gastonia, NC-SC
- Percentage increase in value of new residential housing units: +20.2%
- Total increase in value of new residential housing units: $428,476,000
- Percentage increase in new residential housing units: +27.5%
- Total increase in new residential housing units: +2,443
11. San Diego-Chula Vista-Carlsbad, CA
- Percentage increase in value of new residential housing units: +20.4%
- Total increase in value of new residential housing units: $140,372,000
- Percentage increase in new residential housing units: +2.8%
- Total increase in new residential housing units: +97
10. Minneapolis-St. Paul-Bloomington, MN-WI
- Percentage increase in value of new residential housing units: +22.1%
- Total increase in value of new residential housing units: $405,987,000
- Percentage increase in new residential housing units: +12.3%
- Total increase in new residential housing units: +988
9. Houston-The Woodlands-Sugar Land, TX
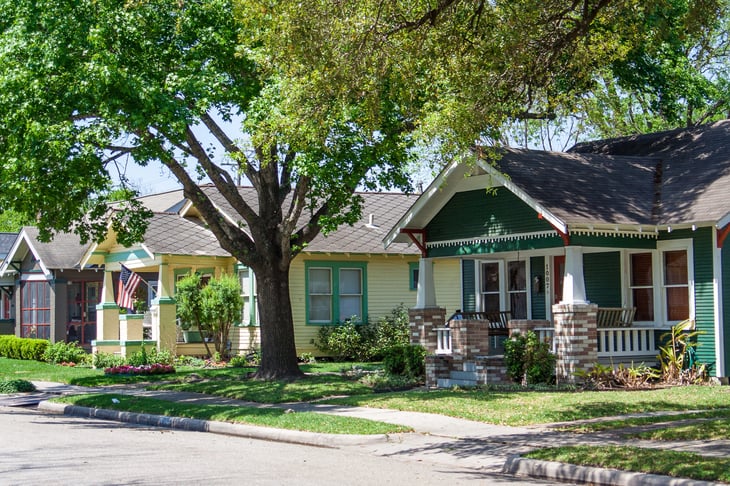
- Percentage increase in value of new residential housing units: +22.7%
- Total increase in value of new residential housing units: $1,023,183,000
- Percentage increase in new residential housing units: +18.2%
- Total increase in new residential housing units: +4,138

8. Boston-Cambridge-Newton, MA-NH
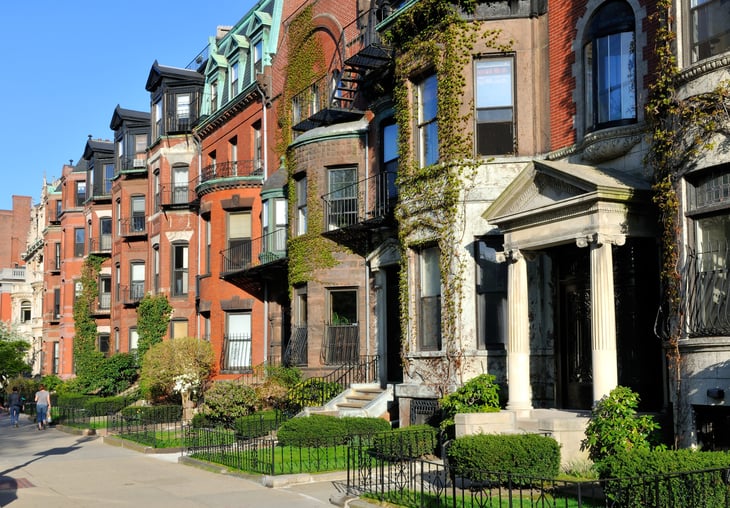
- Percentage increase in value of new residential housing units: +23.8%
- Total increase in value of new residential housing units: $282,736,000
- Percentage increase in new residential housing units: +6.7%
- Total increase in new residential housing units: +371
7. Orlando-Kissimmee-Sanford, FL
- Percentage increase in value of new residential housing units: +26.8%
- Total increase in value of new residential housing units: $513,628,000
- Percentage increase in new residential housing units: +41.8%
- Total increase in new residential housing units: +3,526
6. Rochester, NY
- Percentage increase in value of new residential housing units: +31.1%
- Total increase in value of new residential housing units: $42,197,000
- Percentage increase in new residential housing units: +47.0%
- Total increase in new residential housing units: +304
5. Baltimore-Columbia-Towson, MD
- Percentage increase in value of new residential housing units: +32.6%
- Total increase in value of new residential housing units: $147,101,000
- Percentage increase in new residential housing units: +59.6%
- Total increase in new residential housing units: +1,181
4. Detroit-Warren-Dearborn, MI
- Percentage increase in value of new residential housing units: +33.3%
- Total increase in value of new residential housing units: $244,210,000
- Percentage increase in new residential housing units: +1.4%
- Total increase in new residential housing units: +41
3. New York-Newark-Jersey City, NY-NJ-PA

- Percentage increase in value of new residential housing units: +33.6%
- Total increase in value of new residential housing units: $845,609,000
- Percentage increase in new residential housing units: +30.3%
- Total increase in new residential housing units: +5,243
2. Riverside-San Bernardino-Ontario, CA
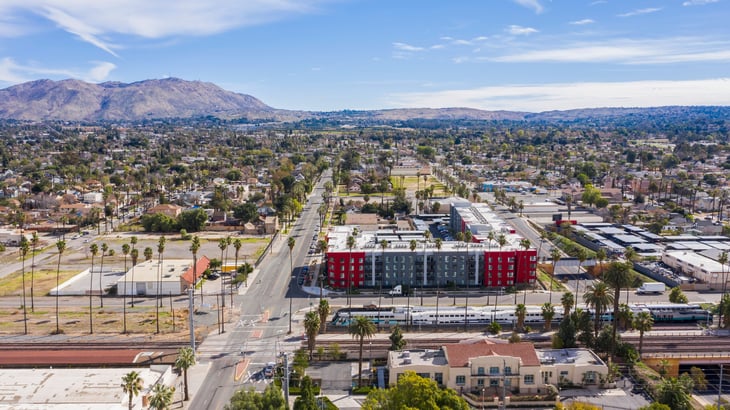
- Percentage increase in value of new residential housing units: +34.3%
- Total increase in value of new residential housing units: $379,935,000
- Percentage increase in new residential housing units: +23.7%
- Total increase in new residential housing units: +1,104
1. Indianapolis-Carmel-Anderson, IN
- Percentage increase in value of new residential housing units: +34.3%
- Total increase in value of new residential housing units: $371,468,000
- Percentage increase in new residential housing units: +68.4%
- Total increase in new residential housing units: +2,449
Methodology

To determine the metros with the biggest increases in home construction, researchers at Construction Coverage analyzed the latest data from the U.S. Census Bureau’s Building Permits Survey.
The researchers ranked metro areas according to the value of residential housing permits authorized from January through April of 2022 compared with the same period in 2021. The total increase in value of new residential housing units, the percentage increase in new residential housing units, and the total increase in new residential housing units were also calculated.
Only metropolitan areas with at least 100,000 people and a monthly coverage percentage of at least 90% in January 2021 were included in the analysis.
Add a Comment
Our Policy: We welcome relevant and respectful comments in order to foster healthy and informative discussions. All other comments may be removed. Comments with links are automatically held for moderation.