


This story originally appeared on HireAHelper.
Slow wage growth and increasing wage inequality have characterized the U.S. labor market for the past several decades. The COVID-19 pandemic has disproportionately impacted lower-wage workers, only serving to exacerbate these problems. Now, a year into the pandemic, millions of workers remain unemployed and many businesses still face restrictions.
Over the past five years, average annual wages increased by 4.8%, after adjusting for inflation. However, much of the increase in average wages can be attributed to growing wages among the highest earners. According to an analysis of Current Population Survey data by the Economic Policy Institute (EPI), real median hourly wages grew by 15% from 1979 to 2019. In comparison, workers in the 95th percentile saw their wages grow by 63%, while workers in the 10th percentile only experienced wage growth of about 3%.
Alongside more pronounced wage inequality over the years, racial and ethnic pay disparities have continued to persist. EPI’s analysis of 2019 Current Population Survey data shows that white and Hispanic workers outearn Black workers at every level of education. Whites also outearn Hispanics at every education level except those with less than a high school degree. Racial wage gaps are most significant among college degree holders, where white workers earn 29% more than Black workers and 18% more than Hispanic workers.
While real wages increased by nearly 5% nationally over the past five years, the average workers in some parts of the country experienced little to no gains. At a regional level, the South and Southeast saw lower average wage growth, while certain Northern states experienced meaningful gains. Hawaii and Washington had the fastest-growing wages in the country, with average annual wages increasing by 9.9% and 9.2%, respectively. Conversely, Alaska, Delaware, New Mexico, and Mississippi experienced no statistically significant change in real wages.
To determine the metros with the fastest-growing wages, researchers at HireAHelper analyzed data from the U.S. Bureau of Labor Statistics’s 2019 and 2014 Occupational Employment Statistics data (OES), which reflects the most recent five-year period available. The researchers ranked metro areas according to the inflation-adjusted five-year change in average wages across all workers. Researchers also calculated the occupation with the largest inflation-adjusted wage increase from 2014 to 2019 in each location.
Keep reading to see the large metros with the fastest-growing wages.
15. Rochester, NY
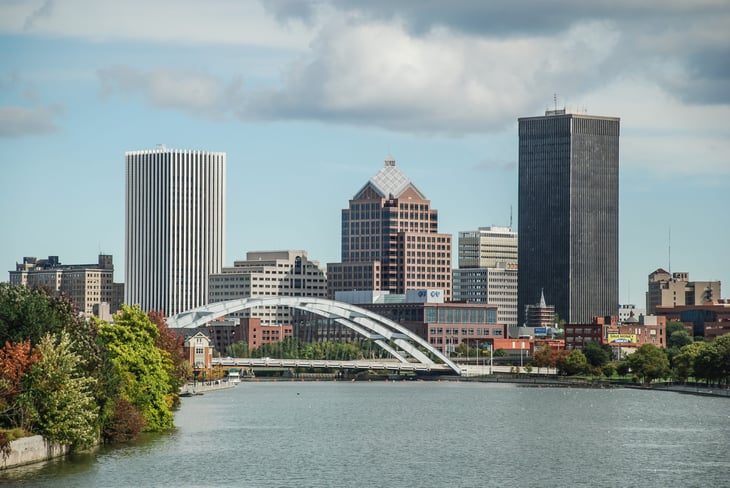
- Inflation-adjusted five-year change in average wage: 5.4%
- 2019 average annual wage: $52,170
- 2014 average annual wage (2019 dollars): $49,476
- 2014 average annual wage (2014 dollars): $45,770
- Job with the largest wage increase: Waiters and waitresses (54.5%)
14. Minneapolis-St. Paul-Bloomington, MN-WI

- Inflation-adjusted five-year change in average wage: 5.4%
- 2019 average annual wage: $59,310
- 2014 average annual wage (2019 dollars): $56,297
- 2014 average annual wage (2014 dollars): $52,080
- Job with the largest wage increase: Waiters and waitresses (44.4%)
13. Phoenix-Mesa-Scottsdale, AZ
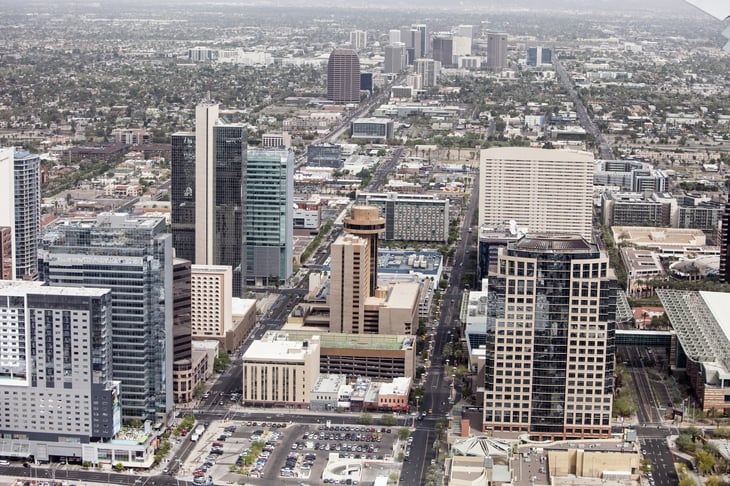
- Inflation-adjusted five-year change in average wage: 5.6%
- 2019 average annual wage: $52,330
- 2014 average annual wage (2019 dollars): $49,551
- 2014 average annual wage (2014 dollars): $45,840
- Job with the largest wage increase: Bartenders (69.3%)
12. Tampa-St. Petersburg-Clearwater, FL
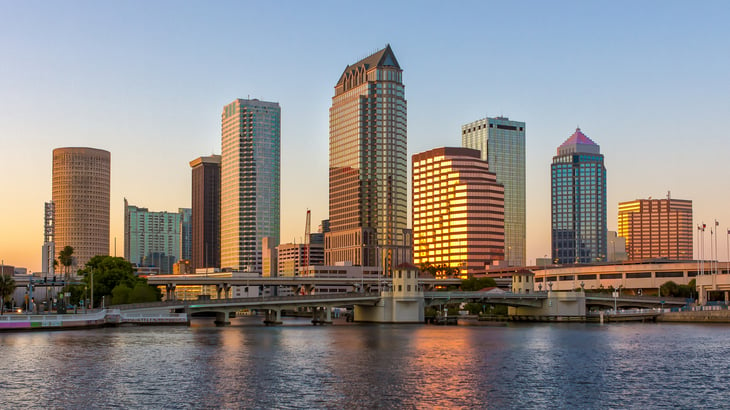
- Inflation-adjusted five-year change in average wage: 5.7%
- 2019 average annual wage: $49,590
- 2014 average annual wage (2019 dollars): $46,935
- 2014 average annual wage (2014 dollars): $43,420
- Job with the largest wage increase: Real estate sales agents (58.9%)

11. Boston-Cambridge-Nashua, MA-NH

- Inflation-adjusted five-year change in average wage: 5.8%
- 2019 average annual wage: $69,240
- 2014 average annual wage (2019 dollars): $65,442
- 2014 average annual wage (2014 dollars): $60,540
- Job with the largest wage increase: Telemarketers (37.5%)
10. Austin-Round Rock, TX

- Inflation-adjusted five-year change in average wage: 6.0%
- 2019 average annual wage: $55,190
- 2014 average annual wage (2019 dollars): $52,048
- 2014 average annual wage (2014 dollars): $48,150
- Job with the largest wage increase: Chefs and head cooks (43.2%)
9. Riverside-San Bernardino-Ontario, CA

- Inflation-adjusted five-year change in average wage: 6.1%
- 2019 average annual wage: $50,700
- 2014 average annual wage (2019 dollars): $47,768
- 2014 average annual wage (2014 dollars): $44,190
- Job with the largest wage increase: Chefs and head cooks (59.8%)
8. Orlando-Kissimmee-Sanford, FL
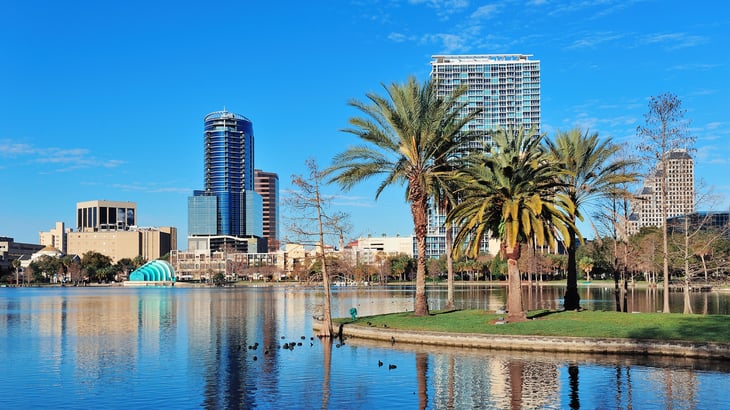
- Inflation-adjusted five-year change in average wage: 6.2%
- 2019 average annual wage: $46,140
- 2014 average annual wage (2019 dollars): $43,455
- 2014 average annual wage (2014 dollars): $40,200
- Job with the largest wage increase: Merchandise displayers and window trimmers (42.5%)
7. Portland-Vancouver-Hillsboro, OR-WA

- Inflation-adjusted five-year change in average wage: 6.2%
- 2019 average annual wage: $58,240
- 2014 average annual wage (2019 dollars): $54,816
- 2014 average annual wage (2014 dollars): $50,710
- Job with the largest wage increase: Bartenders (36.8%)
6. Providence-Warwick, RI-MA

- Inflation-adjusted five-year change in average wage: 6.4%
- 2019 average annual wage: $55,930
- 2014 average annual wage (2019 dollars): $52,557
- 2014 average annual wage (2014 dollars): $48,620
- Job with the largest wage increase: Aircraft mechanics and service technicians (55.0%)
5. Raleigh, NC

- Inflation-adjusted five-year change in average wage: 7.0%
- 2019 average annual wage: $54,850
- 2014 average annual wage (2019 dollars): $51,270
- 2014 average annual wage (2014 dollars): $47,430
- Job with the largest wage increase: Reservation and transportation ticket agents and travel clerks (49.9%)
4. Buffalo-Cheektowaga-Niagara Falls, NY
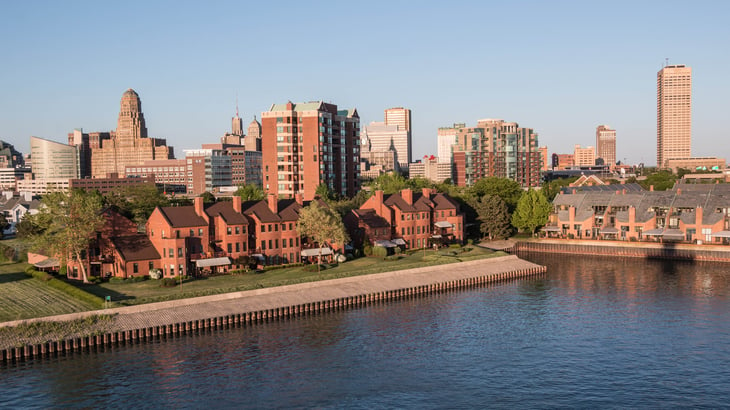
- Inflation-adjusted five-year change in average wage: 7.3%
- 2019 average annual wage: $50,780
- 2014 average annual wage (2019 dollars): $47,335
- 2014 average annual wage (2014 dollars): $43,790
- Job with the largest wage increase: Tire repairers and changers (60.8%)
3. Denver-Aurora-Lakewood, CO

- Inflation-adjusted five-year change in average wage: 7.3%
- 2019 average annual wage: $61,540
- 2014 average annual wage (2019 dollars): $57,356
- 2014 average annual wage (2014 dollars): $53,060
- Job with the largest wage increase: Multiple machine tool setters, operators, and tenders, metal and plastic (62.5%)
2. San Francisco-Oakland-Hayward, CA

- Inflation-adjusted five-year change in average wage: 8.0%
- 2019 average annual wage: $75,890
- 2014 average annual wage (2019 dollars): $70,252
- 2014 average annual wage (2014 dollars): $64,990
- Job with the largest wage increase: Hosts and hostesses, restaurant, lounge, and coffee shop (44.4%)

1. Seattle-Tacoma-Bellevue, WA
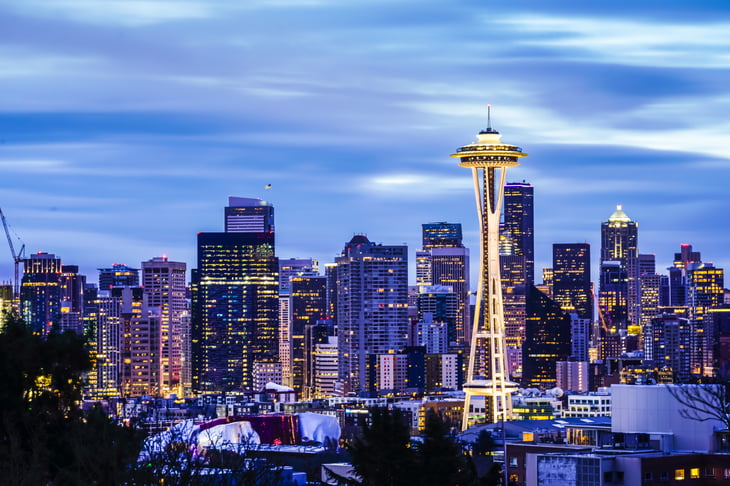
- Inflation-adjusted five-year change in average wage: 10.4%
- 2019 average annual wage: $68,460
- 2014 average annual wage (2019 dollars): $62,015
- 2014 average annual wage (2014 dollars): $57,370
- Job with the largest wage increase: Cement masons and concrete finishers (51.7%)
Detailed Findings & Methodology

With an increase in average wages of over 10%, the Seattle metro area had the fastest-growing wages of all large metros in the country. A number of other tech hubs — San Francisco, Raleigh, Austin, and Boston — also had some of the fastest-growing wages from 2014 to 2019. The metros with the most wage growth also tended to have higher wages overall, a reflection of increasing geographic inequality. The average annual wage for 2019 in the large metros with the most wage growth was $57,357, compared with $53,490 at the national level.
Some of the small and midsize metros with the fastest-growing wages had even higher levels of wage growth from 2014 to 2019. A few of the midsize metros — Honolulu and Salinas, California — had wage growth of over 10%, while seven of the small metros with the fastest-growing wages exceeded this mark.
At the occupation level within specific metropolitan areas, large changes in average wages can be observed over a five-year period for a variety of reasons outside of hourly wage increases for specific workers. For example, such changes in average wages could be due to changes in local minimum wage laws that have had a disproportionate impact on specific workers, the success or failure of specific local businesses employing large numbers of workers in particular occupations, or changes in the number of available low- or high-wage positions within specific occupations, to name a few. As a result, the jobs reporting the largest wage gains at the local level are varied, running the gamut from cement masons to real estate agents.
To determine the metros with the fastest-growing wages, researchers analyzed data from the Bureau of Labor Statistics’s 2019 and 2014 Occupational Employment Statistics data (OES). The researchers ranked metro areas according to the inflation-adjusted change in average wages between 2014 and 2019. In the event of a tie, the metro with the higher average annual wage for 2019 was ranked higher.
The inflation-adjusted change in average wages was calculated as the percentage change in average annual wages between 2014 and 2019, with 2014 wages converted to 2019 dollars using the Bureau of Labor Statistics’ Consumer Price Index Research Series (CPI-U-RS). Researchers also calculated the occupation with the largest inflation-adjusted wage increase from 2014 to 2019; occupations included in this analysis were limited to the 200 jobs with the greatest employment nationally. All percentage increases are statistically significant at the 10% confidence level.
Only metropolitan areas with at least 100,000 people were included in the analysis. Additionally, metro areas were grouped into the following cohorts based on population size:
- Small metros: 100,000–349,999
- Midsize metros: 350,000–999,999
- Large metros: 1 million or more
Add a Comment
Our Policy: We welcome relevant and respectful comments in order to foster healthy and informative discussions. All other comments may be removed. Comments with links are automatically held for moderation.