



Editor's Note: This story originally appeared on Namechk.
The share of adult children living with their parents is much higher than even 20 years ago due to factors such as lower marriage rates, rising housing costs, and, more recently, higher unemployment rates.
According to the most recent data from the U.S. Census Bureau, the share of adults aged 25 and older living in their parents’ homes was 7.3% in 2019. However, experts predict this number is likely to climb even higher as a result of the COVID-19 pandemic.
To determine the U.S. metropolitan areas with the most adults still living at home, researchers at NameChk analyzed the latest data from the U.S. Census Bureau. The researchers ranked metros according to the percentage of adults aged 25 and older still living at home with their parents.
Researchers also calculated the percentage of adults ever married, the total number of adults living with their parents, and the 10-year percentage point change in the share of adults living with their parents. To improve relevance, only metropolitan areas with at least 100,000 people were included in the analysis.
Here are the metros with the most adults still living at home.
15. Detroit-Warren-Dearborn, MI

- Percentage of adults living with parents: 8.0%
- Percentage of adults ever married: 75.3%
- Total adults living with parents: 235,436
- 10-year percentage point change in adults living with parents: -0.1

14. Richmond, VA

- Percentage of adults living with parents: 8.1%
- Percentage of adults ever married: 76.3%
- Total adults living with parents: 71,640
- 10-year percentage point change in adults living with parents: +2.6
13. Tampa-St. Petersburg-Clearwater, FL
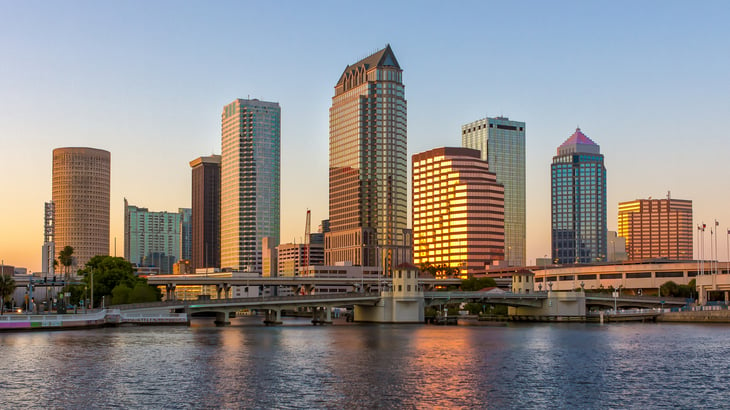
- Percentage of adults living with parents: 8.1%
- Percentage of adults ever married: 78.8%
- Total adults living with parents: 185,113
- 10-year percentage point change in adults living with parents: +2.5
12. Chicago-Naperville-Elgin, IL-IN-WI
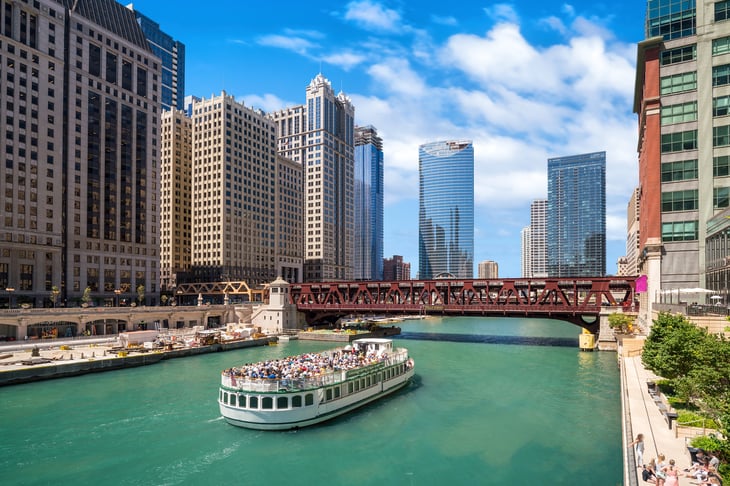
- Percentage of adults living with parents: 8.2%
- Percentage of adults ever married: 75.0%
- Total adults living with parents: 519,812
- 10-year percentage point change in adults living with parents: +0.8
11. Philadelphia-Camden-Wilmington, PA-NJ-DE-MD

- Percentage of adults living with parents: 8.6%
- Percentage of adults ever married: 74.0%
- Total adults living with parents: 358,476
- 10-year percentage point change in adults living with parents: +1.4
10. New York-Newark-Jersey City, NY-NJ-PA

- Percentage of adults living with parents: 8.7%
- Percentage of adults ever married: 73.4%
- Total adults living with parents: 1,190,844
- 10-year percentage point change in adults living with parents: +0.5
9. Providence-Warwick, RI-MA
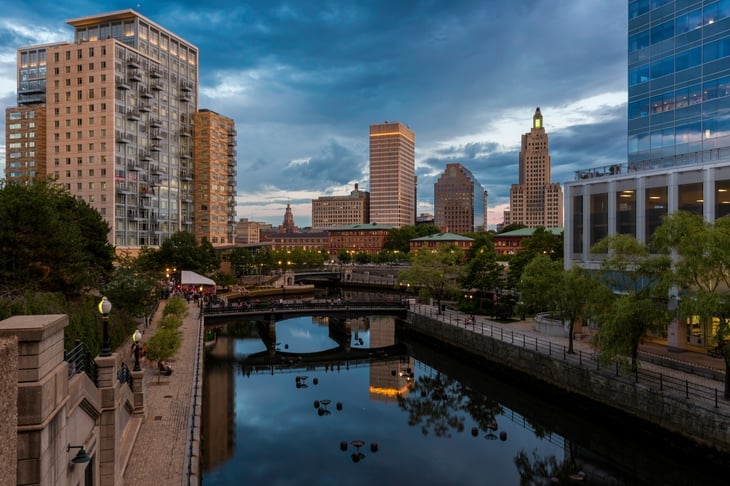
- Percentage of adults living with parents: 8.8%
- Percentage of adults ever married: 75.1%
- Total adults living with parents: 99,947
- 10-year percentage point change in adults living with parents: +2.0
8. San Diego-Carlsbad, CA

- Percentage of adults living with parents: 8.9%
- Percentage of adults ever married: 77.4%
- Total adults living with parents: 200,476
- 10-year percentage point change in adults living with parents: +2.5
7. Orlando-Kissimmee-Sanford, FL
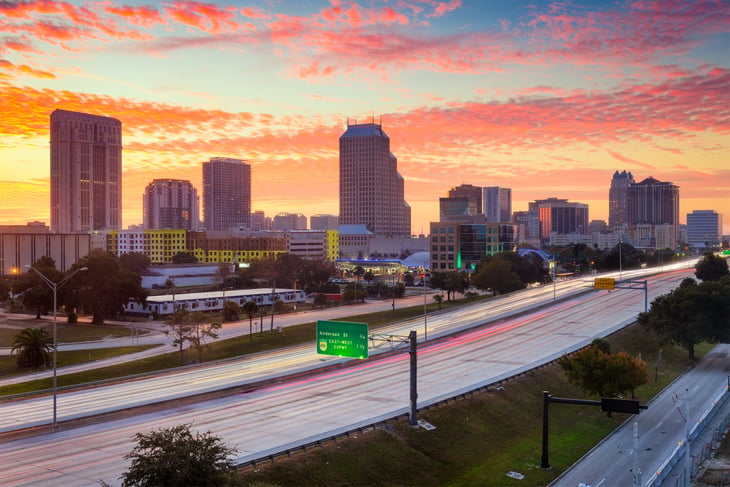
- Percentage of adults living with parents: 9.4%
- Percentage of adults ever married: 76.8%
- Total adults living with parents: 162,684
- 10-year percentage point change in adults living with parents: +2.1
6. Miami-Fort Lauderdale-West Palm Beach, FL

- Percentage of adults living with parents: 10.2%
- Percentage of adults ever married: 76.0%
- Total adults living with parents: 442,468
- 10-year percentage point change in adults living with parents: +2.3
5. Memphis, TN-MS-AR

- Percentage of adults living with parents: 10.2%
- Percentage of adults ever married: 72.9%
- Total adults living with parents: 83,624
- 10-year percentage point change in adults living with parents: +3.1
4. Los Angeles-Long Beach-Anaheim, CA

- Percentage of adults living with parents: 10.6%
- Percentage of adults ever married: 71.1%
- Total adults living with parents: 958,302
- 10-year percentage point change in adults living with parents: +2.6
3. New Orleans-Metairie, LA
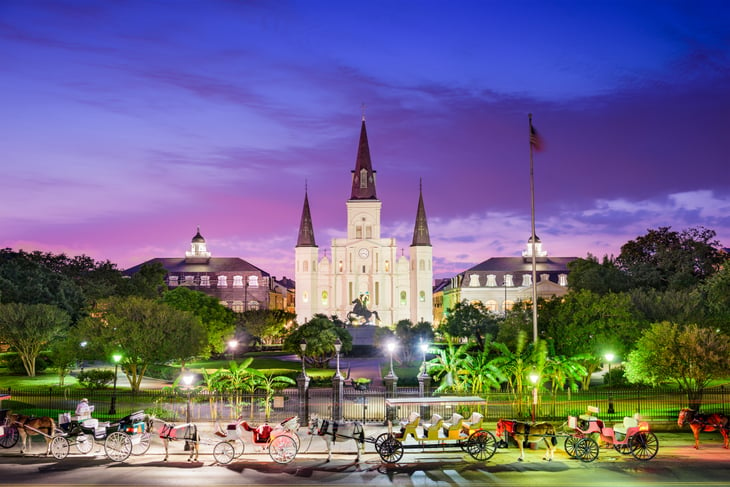
- Percentage of adults living with parents: 10.8%
- Percentage of adults ever married: 72.7%
- Total adults living with parents: 94,618
- 10-year percentage point change in adults living with parents: +2.3
2. San Antonio-New Braunfels, TX

- Percentage of adults living with parents: 11.1%
- Percentage of adults ever married: 77.3%
- Total adults living with parents: 176,838
- 10-year percentage point change in adults living with parents: +2.6
1. Riverside-San Bernardino-Ontario, CA
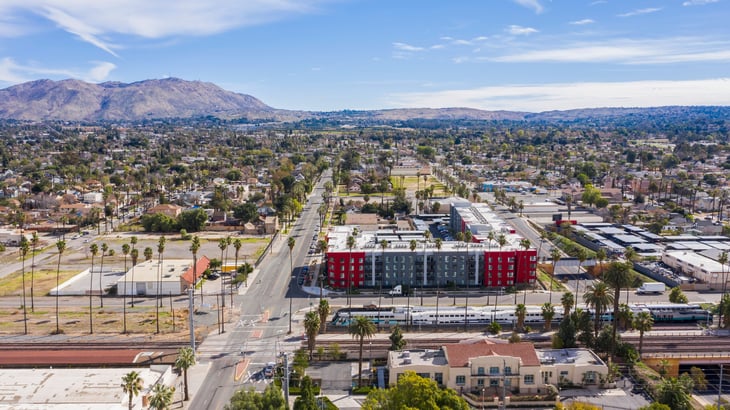
- Percentage of adults living with parents: 11.6%
- Percentage of adults ever married: 78.1%
- Total adults living with parents: 343,401
- 10-year percentage point change in adults living with parents: +4.3
Methodology

To determine the U.S. metropolitan areas with the most adults still living at home, researchers at NameChk analyzed the latest data from the U.S. Census Bureau’s American Community Survey Public Use Microdata Sample. The researchers ranked metros according to the percentage of adults aged 25 and older still living at home with their parents. Researchers also calculated the percentage of adults ever married, the total number of adults living with their parents, and the 10-year change in the percentage of adults living with their parents.
To improve relevance, only metropolitan areas with at least 100,000 people were included in the analysis.

Add a Comment