


Editor's Note: This story originally appeared on HireAHelper.
U.S. Census Bureau data puts the number of Millennials in the United States at roughly 72 million, surpassing Baby Boomers to make Millennials the nation’s most populous generation. While not as racially and ethnically diverse as the up-and-coming Generation Z, Millennials are more diverse than the population as a whole, and increasingly so; according to the Pew Research Center, immigration is adding more numbers to the Millennial population than it is to any other demographic group in the United States.
The ascendance of the Millennial population is happening in tandem with a decline in America’s majority white population. According to U.S. Census Bureau data, about 4 out of 10 people in the United States identify as non-white, a proportion that has been increasing for decades. But the period from 2010 to 2020 marked America’s first-ever decade with both a decline in the white population proportion and a decline in absolute numbers. This means that all of the nation’s population growth over the past decade was attributed to racial and ethnic minorities.
At the state level, diversity among the Millennial population and among the general population track similarly. In 2020, data computed by the Census Bureau using a Diversity Index, which measures the probability that two randomly chosen people will be from different ethnic and racial groups, showed that Hawaii had an overall DI score of 76%, the highest among the states. Employing the same methodology to determine the makeup of the Millennial population here, Hawaii also ranks the highest among U.S. states, with a DI score of 78.4% for Millennials.
At the metro level, from 2010 to 2020, white population proportions decreased in 381 of America’s 384 metropolitan areas, according to the Brookings Institution. And 2020 census data shows there were minority-white populations in 32 of America’s 100 largest metropolitan areas, including New York, Chicago, Los Angeles, Miami, and Dallas.
Using data from the U.S. Census Bureau’s 2020 ACS PUMS 5-Year Estimates, here are the top cities with the most diverse Millennial populations.
15. Chicago-Naperville-Elgin, IL-IN-WI
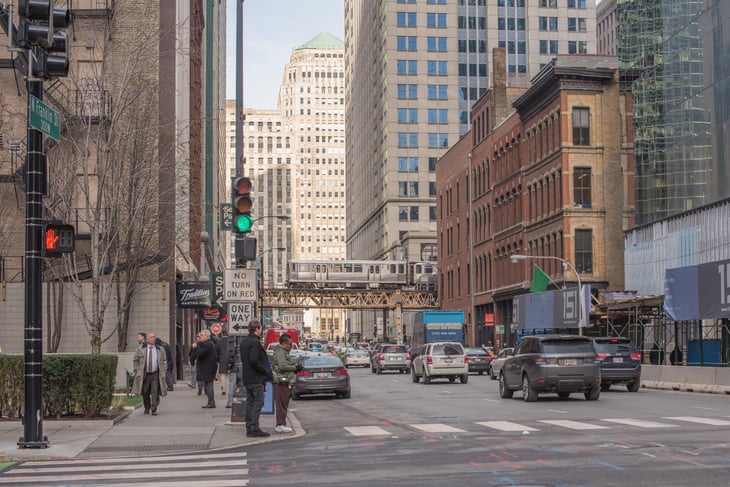
- Diversity index: 66.7%
- Hispanic or Latino: 518,061
- White alone non-Hispanic: 1,050,837
- Black or African-American alone non-Hispanic: 336,399
- American Indian and Alaska Native alone non-Hispanic: 1,651
- Asian alone non-Hispanic: 175,305
- Native Hawaiian and Other Pacific Islander alone non-Hispanic: 708
- Some Other Race alone non-Hispanic: 5,224
- Multiracial non-Hispanic: 47,084
14. Los Angeles-Long Beach-Anaheim, CA
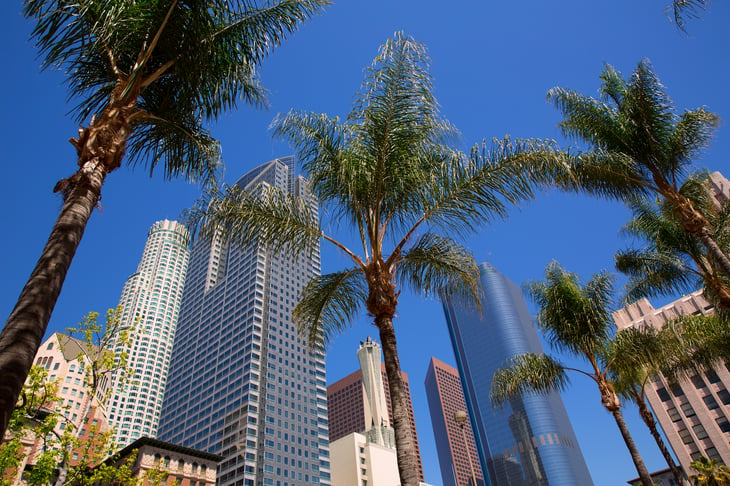
- Diversity index: 67.4%
- Hispanic or Latino: 1,501,644
- White alone non-Hispanic: 869,764
- Black or African-American alone non-Hispanic: 201,832
- American Indian and Alaska Native alone non-Hispanic: 5,561
- Asian alone non-Hispanic: 503,078
- Native Hawaiian and Other Pacific Islander alone non-Hispanic: 6,930
- Some Other Race alone non-Hispanic: 10,414
- Multiracial non-Hispanic: 89,860
13. Atlanta-Sandy Springs-Alpharetta, GA
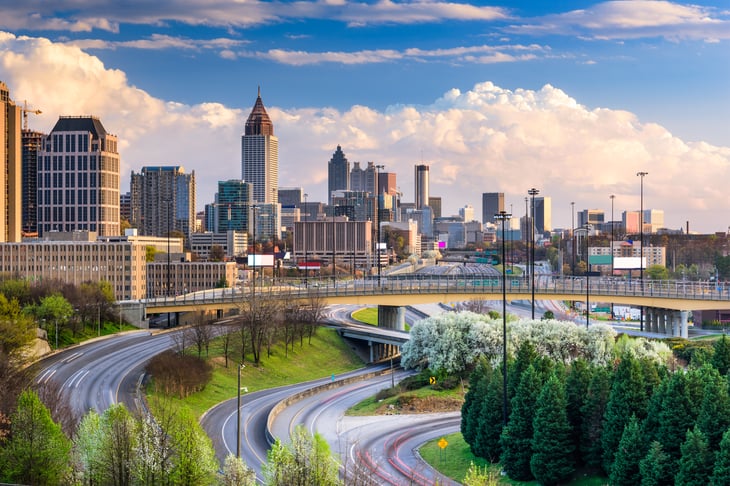
- Diversity index: 67.5%
- Hispanic or Latino: 159,585
- White alone non-Hispanic: 560,706
- Black or African-American alone non-Hispanic: 490,680
- American Indian and Alaska Native alone non-Hispanic: 1,929
- Asian alone non-Hispanic: 97,250
- Native Hawaiian and Other Pacific Islander alone non-Hispanic: 859
- Some Other Race alone non-Hispanic: 5,492
- Multiracial non-Hispanic: 31,939
12. Orlando-Kissimmee-Sanford, FL
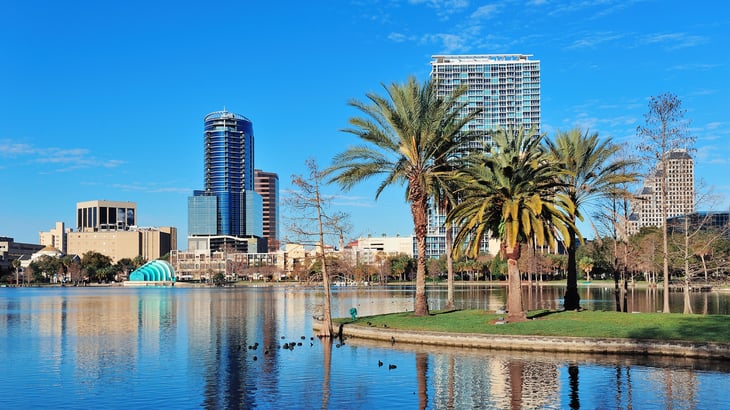
- Diversity index: 68.0%
- Hispanic or Latino: 205,600
- White alone non-Hispanic: 248,220
- Black or African-American alone non-Hispanic: 94,153
- American Indian and Alaska Native alone non-Hispanic: 490
- Asian alone non-Hispanic: 28,052
- Native Hawaiian and Other Pacific Islander alone non-Hispanic: 385
- Some Other Race alone non-Hispanic: 3,838
- Multiracial non-Hispanic: 15,559
11. San Diego-Chula Vista-Carlsbad, CA
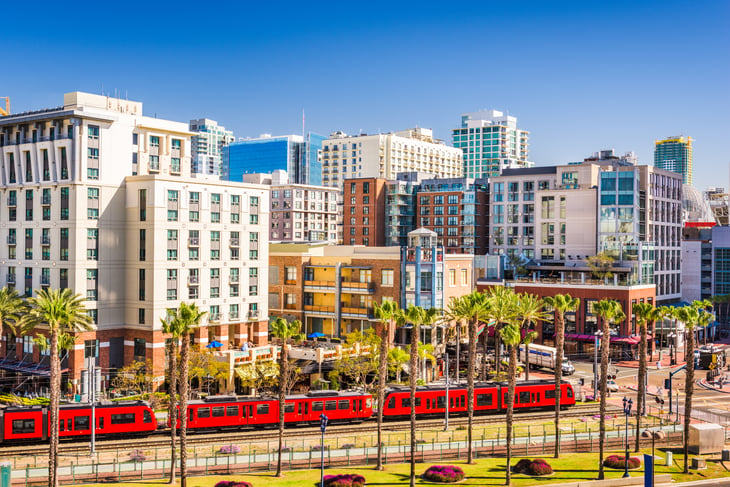
- Diversity index: 68.0%
- Hispanic or Latino: 295,124
- White alone non-Hispanic: 347,403
- Black or African-American alone non-Hispanic: 43,014
- American Indian and Alaska Native alone non-Hispanic: 3,321
- Asian alone non-Hispanic: 105,388
- Native Hawaiian and Other Pacific Islander alone non-Hispanic: 3,221
- Some Other Race alone non-Hispanic: 1,698
- Multiracial non-Hispanic: 33,150
10. San Jose-Sunnyvale-Santa Clara, CA

- Diversity index: 68.8%
- Hispanic or Latino: 122,851
- White alone non-Hispanic: 124,468
- Black or African American alone non-Hispanic: 11,675
- American Indian and Alaska Native alone non-Hispanic: 464
- Asian alone non-Hispanic: 203,974
- Native Hawaiian and Other Pacific Islander alone non-Hispanic: 2,063
- Some Other Race alone non-Hispanic: 1,486
- Multiracial non-Hispanic: 15,406
9. Stockton, CA
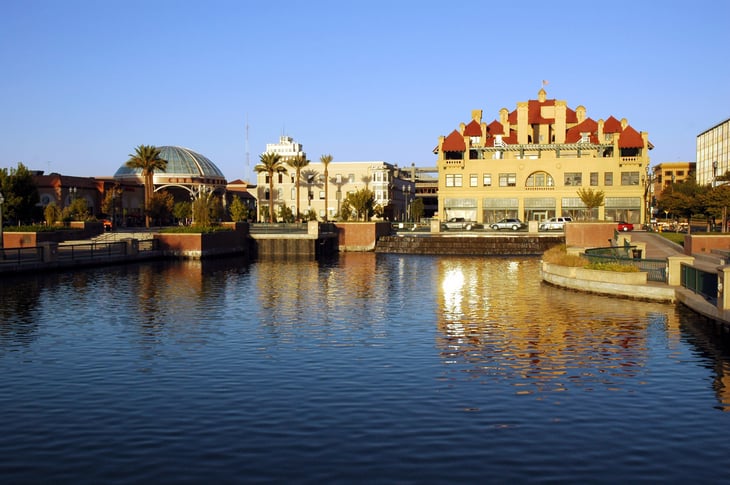
- Diversity index: 69.2%
- Hispanic or Latino: 74,370
- White alone non-Hispanic: 45,420
- Black or African-American alone non-Hispanic: 11,574
- American Indian and Alaska Native alone non-Hispanic: 357
- Asian alone non-Hispanic: 28,215
- Native Hawaiian and Other Pacific Islander alone non-Hispanic: 615
- Some Other Race alone non-Hispanic: 26
- Multiracial non-Hispanic: 6,212
8. Sacramento-Roseville-Folsom, CA
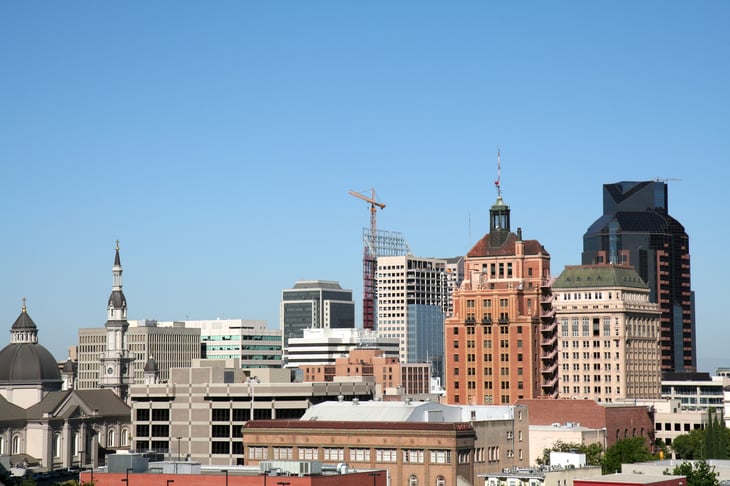
- Diversity index: 69.4%
- Hispanic or Latino: 126,429
- White alone non-Hispanic: 244,150
- Black or African-American alone non-Hispanic: 37,437
- American Indian and Alaska Native alone non-Hispanic: 1,626
- Asian alone non-Hispanic: 76,955
- Native Hawaiian and Other Pacific Islander alone non-Hispanic: 5,122
- Some Other Race alone non-Hispanic: 2,065

7. Dallas-Fort Worth-Arlington, TX
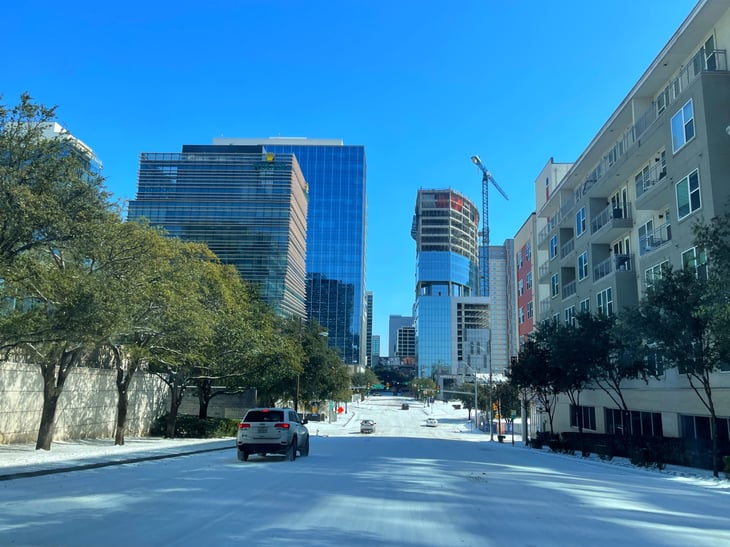
- Diversity index: 70.1%
- Hispanic or Latino: 532,954
- White alone non-Hispanic: 711,926
- Black or African-American alone non-Hispanic: 292,190
- American Indian and Alaska Native alone non-Hispanic: 3,613
- Asian alone non-Hispanic: 147,711
- Native Hawaiian and Other Pacific Islander alone non-Hispanic: 1,736
- Some Other Race alone non-Hispanic: 4,872
- Multiracial non-Hispanic: 39,449
6. Houston-The Woodlands-Sugar Land, TX

- Diversity index: 70.3%
- Hispanic or Latino: 650,166
- White alone non-Hispanic: 522,870
- Black or African-American alone non-Hispanic: 290,230
- American Indian and Alaska Native alone non-Hispanic: 2,960
- Asian alone non-Hispanic: 138,962
- Native Hawaiian and Other Pacific Islander alone non-Hispanic: 999
- Some Other Race alone non-Hispanic: 3,554
- Multiracial non-Hispanic: 32,626
5. Washington-Arlington-Alexandria, DC-VA-MD-WV
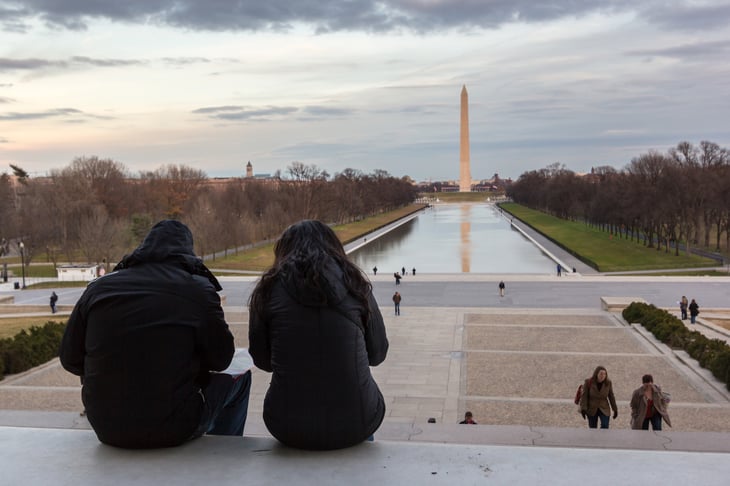
- Diversity index: 71.4%
- Hispanic or Latino: 262,033
- White alone non-Hispanic: 624,807
- Black or African-American alone non-Hispanic: 358,134
- American Indian and Alaska Native alone non-Hispanic: 1,723
- Asian alone non-Hispanic: 164,394
- Native Hawaiian and Other Pacific Islander alone non-Hispanic: 479
- Some Other Race alone non-Hispanic: 5,845
- Multiracial non-Hispanic: 51,815
4. New York-Newark-Jersey City, NY-NJ-PA

- Diversity index: 71.4%
- Hispanic or Latino: 1,224,845
- White alone non-Hispanic: 1,861,067
- Black or African-American alone non-Hispanic: 714,435
- American Indian and Alaska Native alone non-Hispanic: 5,275
- Asian alone non-Hispanic: 584,719
- Native Hawaiian and Other Pacific Islander alone non-Hispanic: 1,418
- Some Other Race alone non-Hispanic: 29,889
- Multiracial non-Hispanic: 94,384
3. Las Vegas-Henderson-Paradise, NV
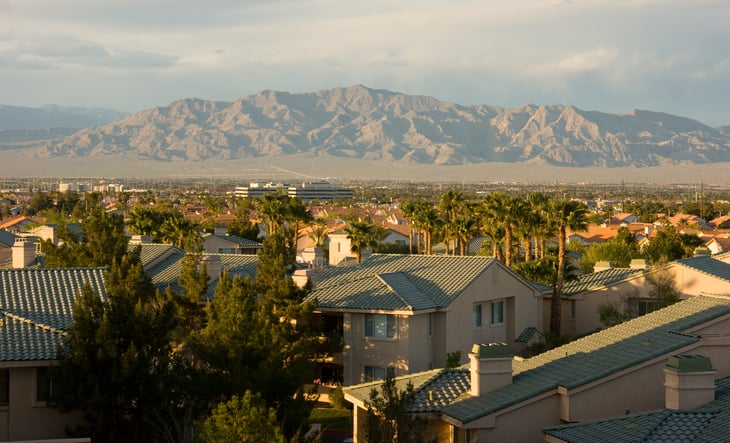
- Diversity index: 71.7%
- Hispanic or Latino: 178,062
- White alone non-Hispanic: 192,339
- Black or African-American alone non-Hispanic: 65,020
- American Indian and Alaska Native alone non-Hispanic: 2,453
- Asian alone non-Hispanic: 51,646
- Native Hawaiian and Other Pacific Islander alone non-Hispanic: 4,205
- Some Other Race alone non-Hispanic: 2,872
- Multiracial non-Hispanic: 21,623
2. San Francisco-Oakland-Berkeley, CA
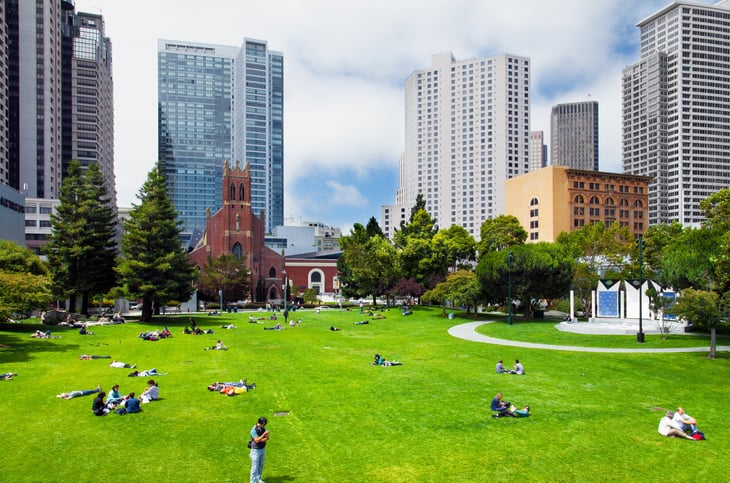
- Diversity index: 73.1%
- Hispanic or Latino: 272,779
- White alone non-Hispanic: 426,082
- Black or African-American alone non-Hispanic: 78,284
- American Indian and Alaska Native alone non-Hispanic: 1,798
- Asian alone non-Hispanic: 336,070
- Native Hawaiian and Other Pacific Islander alone non-Hispanic: 7,533
- Some Other Race alone non-Hispanic: 6,566
- Multiracial non-Hispanic: 56,338
1. Urban Honolulu, HI
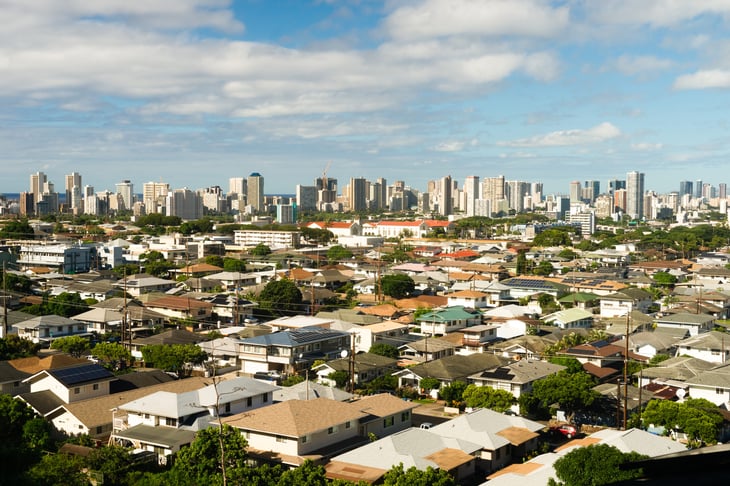
- Diversity index: 77.9%
- Hispanic or Latino: 27,711
- White alone non-Hispanic: 50,690
- Black or African-American alone non-Hispanic: 8,708
- American Indian and Alaska Native alone non-Hispanic: 191
- Asian alone non-Hispanic: 76,360
- Native Hawaiian and Other Pacific Islander alone non-Hispanic: 21,054
- Some Other Race alone non-Hispanic: 649
- Multiracial non-Hispanic: 43,395
Methodology

The data used in this analysis is from the U.S. Census Bureau’s 2020 ACS PUMS 5-Year Estimates. To determine the locations with the most diverse Millennial populations, researchers calculated a Simpson’s Diversity Index for the Millennial population (aged 26-40 in 2020) using the below demographic groups. The diversity index can be thought of as the chance that two people chosen at random from the population will belong to different racial/ethnic groups.
- Hispanic or Latino
- White alone non-Hispanic
- Black or African-American alone non-Hispanic
- American Indian and Alaska Native alone non-Hispanic
- Asian alone non-Hispanic
- Native Hawaiian and Other Pacific Islander alone non-Hispanic
- Some Other Race alone non-Hispanic
- Multiracial non-Hispanic
Only the 100 largest metropolitan areas with available data were considered in this analysis.
Add a Comment
Our Policy: We welcome relevant and respectful comments in order to foster healthy and informative discussions. All other comments may be removed. Comments with links are automatically held for moderation.