


This story originally appeared on CoPilot.
By forcing many Americans to stay home, COVID-19 created a rare opportunity for states to accelerate much-needed road repairs without interrupting daily commutes.
With traffic reduced, departments of transportation across the country went to work fixing bridges, highways and mass transit systems — many of which were long overdue for repair. According to data from the Federal Highway Administration, 26% of major urban roads in the U.S. are in poor condition.
Apart from being unpleasant to drive on, poor roads are linked to worse traffic, reduced safety and increased vehicle ownership costs. Research from AAA found that potholes alone cost drivers $3 billion a year in vehicle repair costs.
Furthermore, the most recent Urban Mobility Report released by the Texas A&M Transportation Institute found that the average commuter spends 54 hours per year in traffic congestion and suffers a personal cost of $1,080 in time and fuel.
While 2020 will likely be an anomaly, the number of miles traveled on American roads tends to increase each year. Federal Highway Administration data shows that while rural travel has stayed mostly flat since 2000, travel on urban roads has continued to rise alongside increased urbanization.
Even though total state and local spending on roads has likewise gone up, its share of total state and local spending has declined and is insufficient to fund necessary road maintenance in many parts of the country. Not surprisingly, there is significant regional variation when it comes to road quality — a function of differences in funding, climate, commuting patterns and other factors.
Almost half of all major urban roads in Rhode Island (47.9%), California (46.2%), and New Jersey (42.4%) are in poor condition. On the other hand, less than 10% of major urban roads are considered poor in Georgia (6.1%), Tennessee (8.6%), Florida (8.7%), Idaho (8.7%) and Indiana (9.3%).
Overall, states in the South tend to have a smaller share of urban roads in poor condition than states in the Northeast and West Coast.
To find which urban areas have the worst roads, researchers at CoPilot analyzed road quality statistics from the Federal Highway Administration. Using the FHA’s International Roughness Index data, they ranked each urban area based on the percentage of road-miles categorized as poor.
While the locations with the worst roads are geographically diverse, urban areas on the West Coast, especially in California, are disproportionately represented.
Following are the large cities with the worst roads in the U.S.
15. Milwaukee
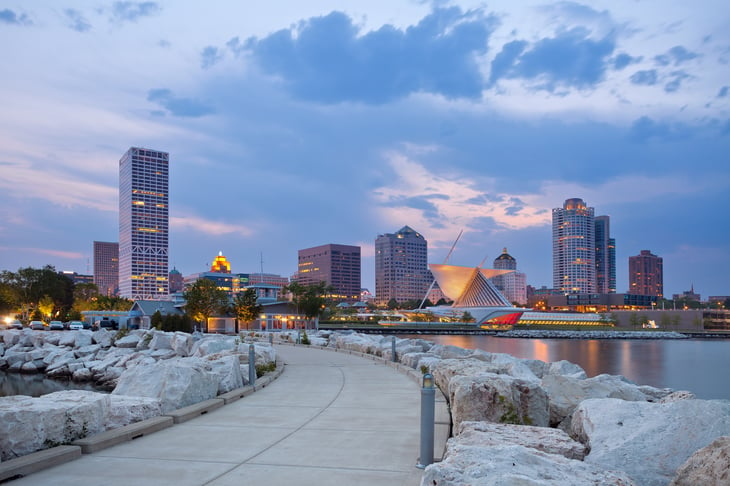
- Percentage of all major roads in poor condition: 33.5%
- Interstates and freeways in poor condition: 7.4%
- Arterials in poor condition: 39.4%
- Minor arterials in poor condition: 100.0%
- Daily vehicle-miles per capita: 24.4
- Miles of road per 1,000 people: 4.8
14. Denver
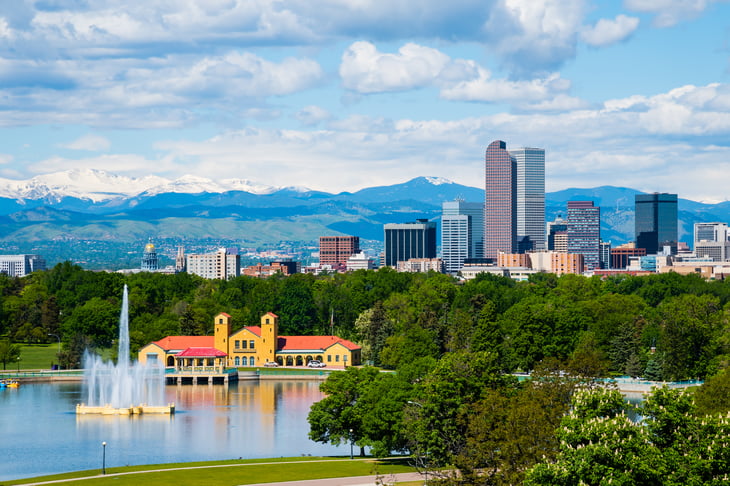
- Percentage of all major roads in poor condition: 36.1%
- Interstates and freeways in poor condition: 6.6%
- Arterials in poor condition: 31.8%
- Minor arterials in poor condition: 52.0%
- Daily vehicle-miles per capita: 25.8
- Miles of road per 1,000 people: 3.9
13. Philadelphia

- Percentage of all major roads in poor condition: 37.7%
- Interstates and freeways in poor condition: 8.7%
- Arterials in poor condition: 37.8%
- Minor arterials in poor condition: 46.2%
- Daily vehicle-miles per capita: 20.0
- Miles of road per 1,000 people: 3.9
12. Dallas

- Percentage of all major roads in poor condition: 37.9%
- Interstates and freeways in poor condition: 8.2%
- Arterials in poor condition: 56.7%
- Minor arterials in poor condition: 100.0%
- Daily vehicle-miles per capita: 28.5
- Miles of road per 1,000 people: 4.5

11. Sacramento, California
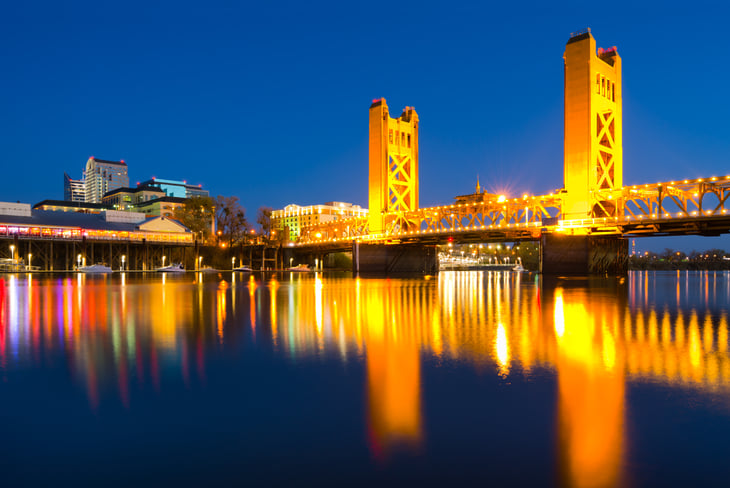
- Percentage of all major roads in poor condition: 38.1%
- Interstates and freeways in poor condition: 3.6%
- Arterials in poor condition: 54.7%
- Minor arterials in poor condition: 34.1%
- Daily vehicle-miles per capita: 24.2
- Miles of road per 1,000 people: 3.5
10. Boston
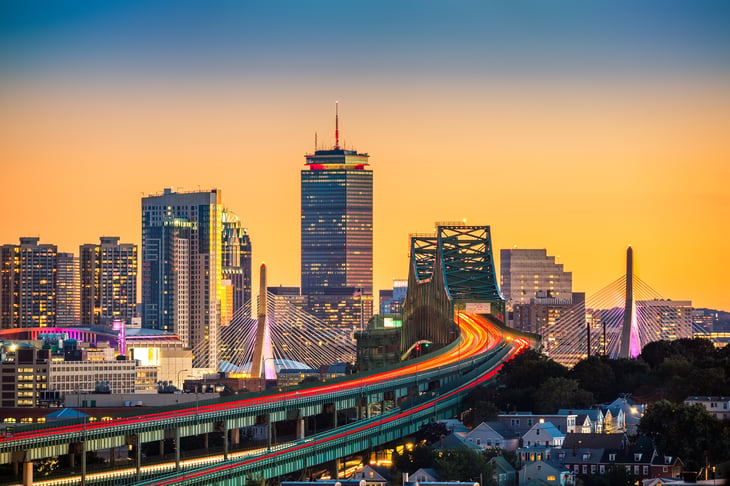
- Percentage of all major roads in poor condition: 39.3%
- Interstates and freeways in poor condition: 5.3%
- Arterials in poor condition: 50.8%
- Minor arterials in poor condition: 42.0%
- Daily vehicle-miles per capita: 27.9
- Miles of road per 1,000 people: 4.3
9. Cleveland
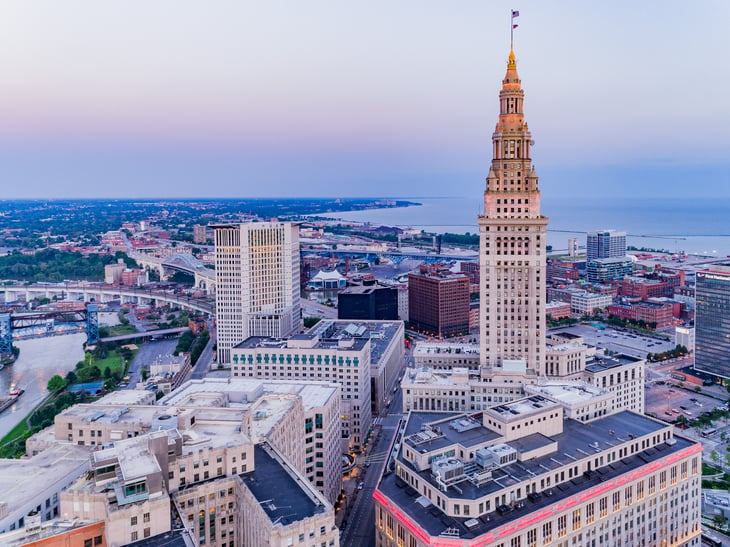
- Percentage of all major roads in poor condition: 40.2%
- Interstates and freeways in poor condition: 7.1%
- Arterials in poor condition: 47.3%
- Minor arterials in poor condition: 48.8%
- Daily vehicle-miles per capita: 24.3
- Miles of road per 1,000 people: 4.1
8. San Diego
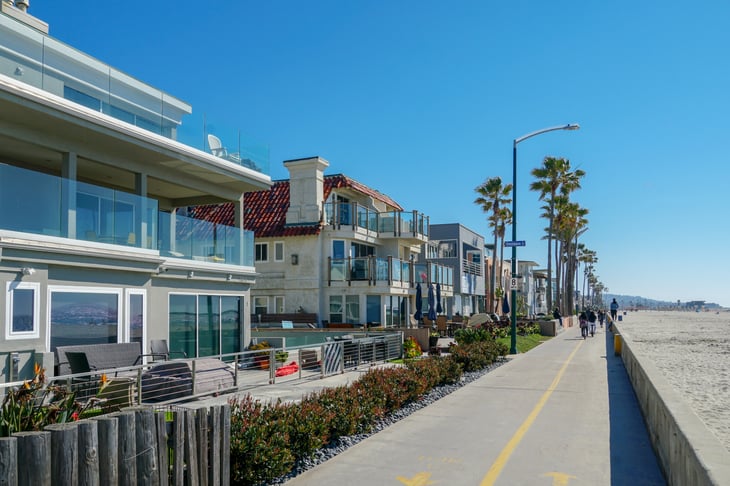
- Percentage of all major roads in poor condition: 43.6%
- Interstates and freeways in poor condition: 3.5%
- Arterials in poor condition: 45.4%
- Minor arterials in poor condition: 58.2%
- Daily vehicle-miles per capita: 25.5
- Miles of road per 1,000 people: 2.6
7. Providence, Rhode Island

- Percentage of all major roads in poor condition: 44.2%
- Interstates and freeways in poor condition: 6.2%
- Arterials in poor condition: 53.4%
- Minor arterials in poor condition: 55.7%
- Daily vehicle-miles per capita: 22.9
- Miles of road per 1,000 people: 5.1
6. Seattle
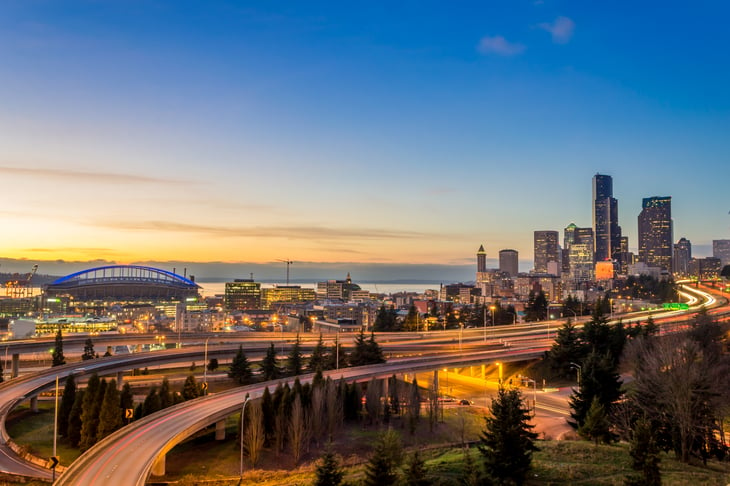
- Percentage of all major roads in poor condition: 44.2%
- Interstates and freeways in poor condition: 12.5%
- Arterials in poor condition: 44.3%
- Minor arterials in poor condition: 51.6%
- Daily vehicle-miles per capita: 23.5
- Miles of road per 1,000 people: 3.6
5. Detroit
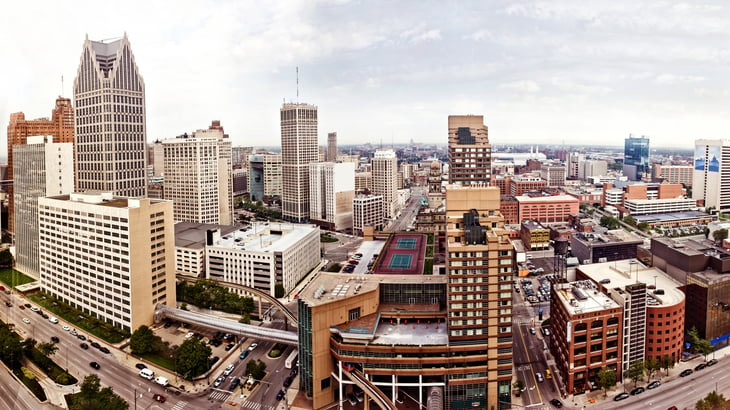
- Percentage of all major roads in poor condition: 44.2%
- Interstates and freeways in poor condition: 9.0%
- Arterials in poor condition: 42.2%
- Minor arterials in poor condition: 53.4%
- Daily vehicle-miles per capita: 25.9
- Miles of road per 1,000 people: 4.1
4. New York City
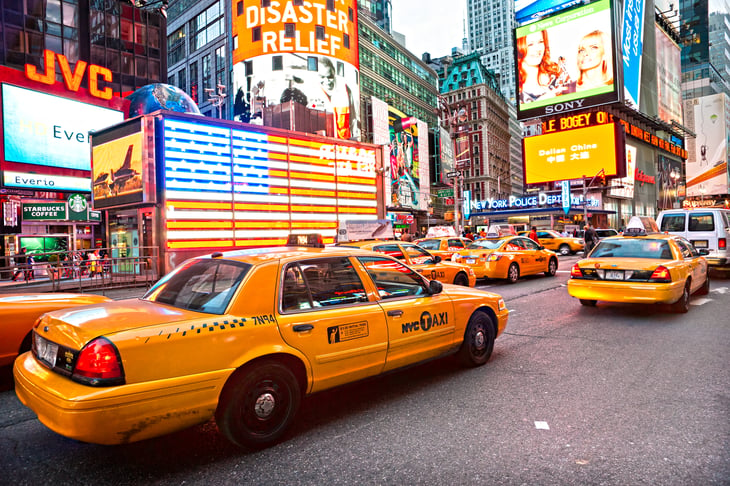
- Percentage of all major roads in poor condition: 45.5%
- Interstates and freeways in poor condition: 18.7%
- Arterials in poor condition: 53.2%
- Minor arterials in poor condition: 48.3%
- Daily vehicle-miles per capita: 16.0
- Miles of road per 1,000 people: 2.4
3. Los Angeles
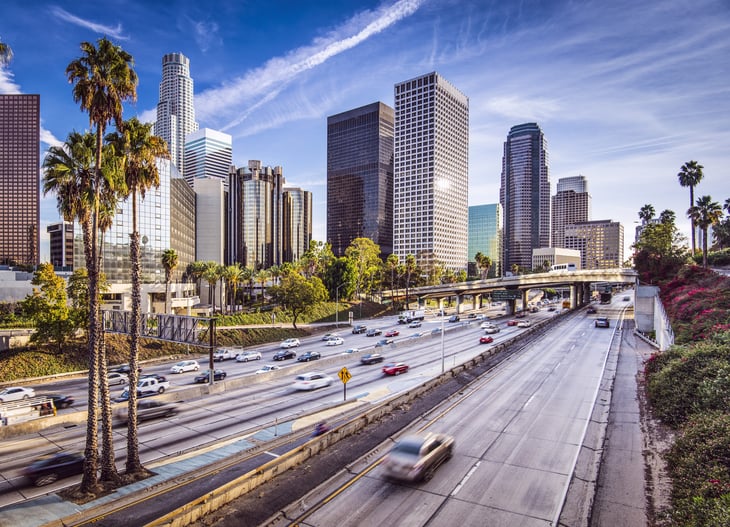
- Percentage of all major roads in poor condition: 62.8%
- Interstates and freeways in poor condition: 11.6%
- Arterials in poor condition: 68.6%
- Minor arterials in poor condition: 68.9%
- Daily vehicle-miles per capita: 22.6
- Miles of road per 1,000 people: 2.1
2. San Jose, California
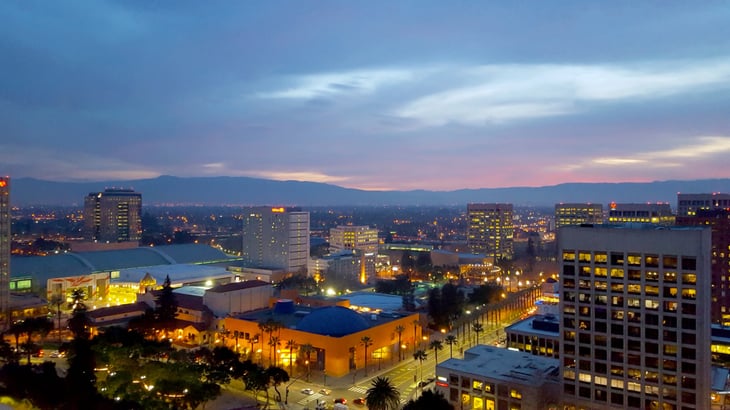
- Percentage of all major roads in poor condition: 63.3%
- Interstates and freeways in poor condition: 9.8%
- Arterials in poor condition: 53.9%
- Minor arterials in poor condition: 88.9%
- Daily vehicle-miles per capita: 22.6
- Miles of road per 1,000 people: 2.4
1. San Francisco
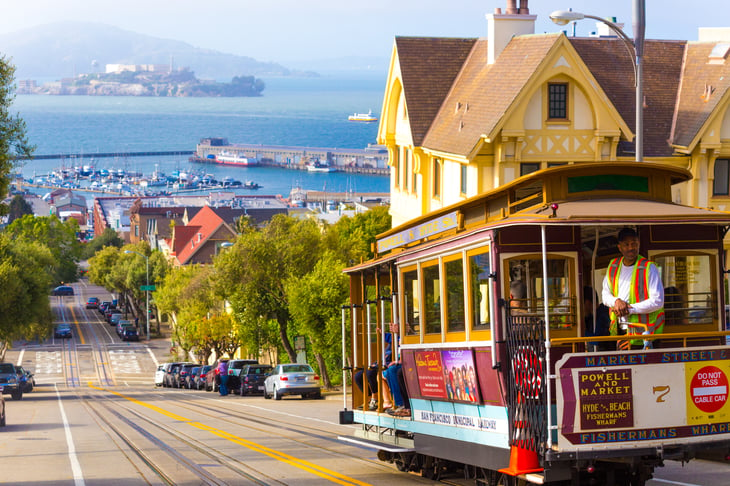
- Percentage of all major roads in poor condition: 71.2%
- Interstates and freeways in poor condition: 15.7%
- Arterials in poor condition: 70.8%
- Minor arterials in poor condition: 88.2%
- Daily vehicle-miles per capita: 21.7
- Miles of road per 1,000 people: 2.3
Add a Comment
Our Policy: We welcome relevant and respectful comments in order to foster healthy and informative discussions. All other comments may be removed. Comments with links are automatically held for moderation.