
Editor's Note: This story originally appeared on Filterbuy.
Where people choose to live, work, and grow their families is one of the most important decisions they will make in life.
Climate, cost of living, economic opportunities, or proximity to family, friends, or desirable amenities may all be factors that people consider when deciding where to live. But one factor that is often overlooked is environmental health, and in that realm, air quality is one of the most important considerations.
Air quality matters because pollution is associated with a number of health problems. High concentrations of pollutants can affect children’s development, cause or worsen respiratory problems like asthma or emphysema, and put people at heightened risk of severe health events like heart attack or stroke.
The data used in this analysis is from the U.S. Environmental Protection Agency and the U.S. Bureau of Economic Analysis dataset. To identify the most expensive locations with the worst air quality, researchers at Filterbuy looked at the median daily air quality index (AQI) for each metropolitan area in 2020.
The AQI is a broad measure of air pollution that takes into account the concentrations of major air pollutants regulated by the Clean Air Act. Higher AQI values correspond to higher levels of air pollution. Only locations with a cost of living greater than the national average, as determined by the Bureau of Economic Analysis, were included in the study.
Here are the expensive metros with the worst air quality.
1. Oxnard-Thousand Oaks-Ventura, CA

Median AQI: 47
Max AQI: 174
Unhealthy or hazardous days: 26
Moderate days: 115
Good days: 225
Cost of living (compared to average): +17.0%
2. Philadelphia-Camden-Wilmington, PA-NJ-DE-MD
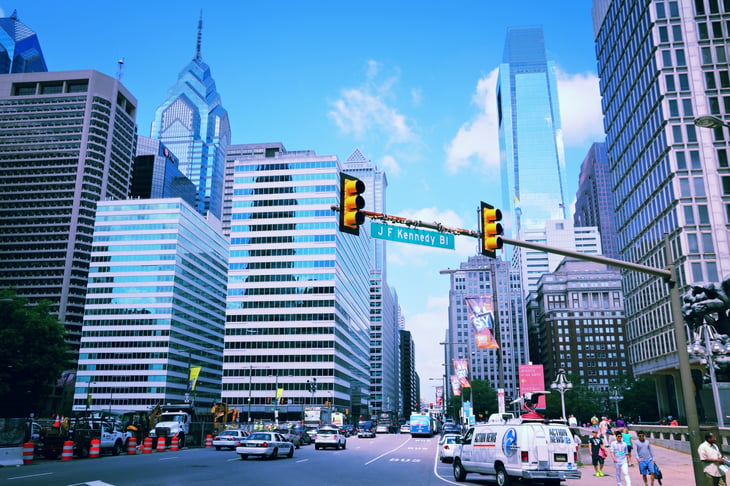
Median AQI: 48
Max AQI: 143
Unhealthy or hazardous days: 8
Moderate days: 152
Good days: 206
Cost of living (compared to average): +5.3%
3. Fort Collins, CO
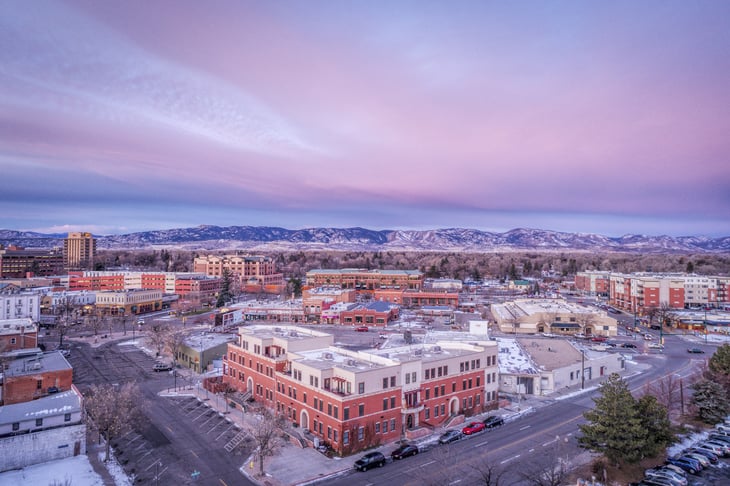
Median AQI: 48
Max AQI: 157
Unhealthy or hazardous days: 19
Moderate days: 125
Good days: 222
Cost of living (compared to average): +2.0%
4. Dallas-Fort Worth-Arlington, TX

Median AQI: 48
Max AQI: 159
Unhealthy or hazardous days: 24
Moderate days: 140
Good days: 202
Cost of living (compared to average): +1.2%
5. San Luis Obispo-Paso Robles-Arroyo Grande, CA

Median AQI: 48
Max AQI: 292
Unhealthy or hazardous days: 31
Moderate days: 124
Good days: 211
Cost of living (compared to average): +10.2%
6. Stockton-Lodi, CA

Median AQI: 49
Max AQI: 195
Unhealthy or hazardous days: 34
Moderate days: 140
Good days: 192
Cost of living (compared to average): +2.2%
7. Chico, CA

Median AQI: 51
Max AQI: 379
Unhealthy or hazardous days: 39
Moderate days: 144
Good days: 183
Cost of living (compared to average): +0.6%
8. Houston-The Woodlands-Sugar Land, TX

Median AQI: 52
Max AQI: 182
Unhealthy or hazardous days: 24
Moderate days: 169
Good days: 173
Cost of living (compared to average): +1.7%
9. Modesto, CA
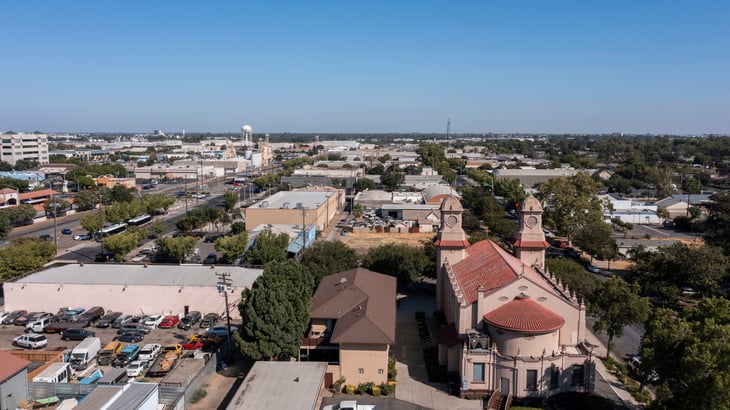
Median AQI: 55
Max AQI: 189
Unhealthy or hazardous days: 37
Moderate days: 173
Good days: 156
Cost of living (compared to average): +1.0%
10. Chicago-Naperville-Elgin, IL-IN-WI
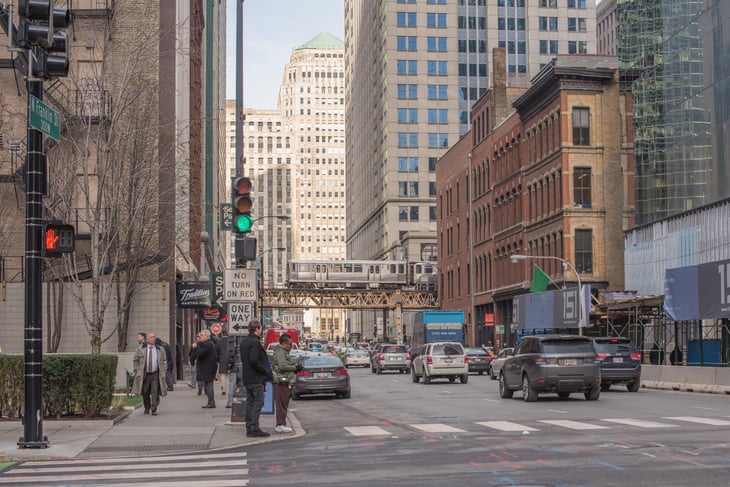
Median AQI: 56
Max AQI: 197
Unhealthy or hazardous days: 28
Moderate days: 217
Good days: 121
Cost of living (compared to average): +2.8%
11. Denver-Aurora-Lakewood, CO

Median AQI: 58
Max AQI: 161
Unhealthy or hazardous days: 34
Moderate days: 213
Good days: 119
Cost of living (compared to average): +4.2%
12. Sacramento–Roseville–Arden-Arcade, CA

Median AQI: 60
Max AQI: 222
Unhealthy or hazardous days: 50
Moderate days: 184
Good days: 132
Cost of living (compared to average): +5.2%
13. San Diego-Carlsbad, CA
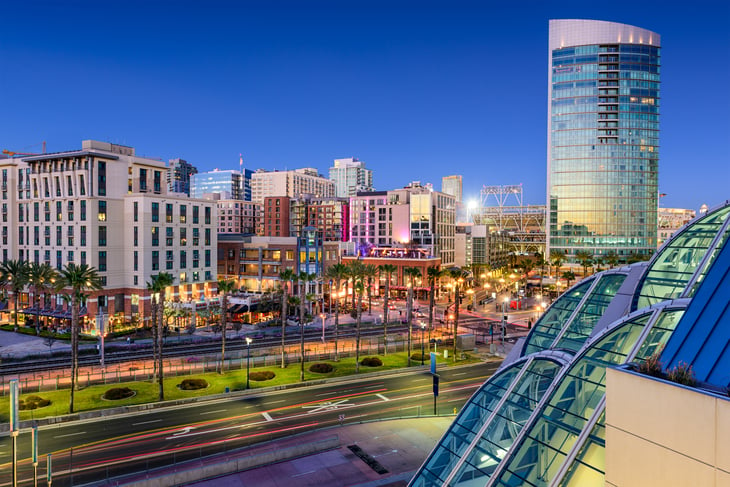
Median AQI: 71
Max AQI: 192
Unhealthy or hazardous days: 49
Moderate days: 257
Good days: 60
Cost of living (compared to average): +17.9
14. Los Angeles-Long Beach-Anaheim, CA
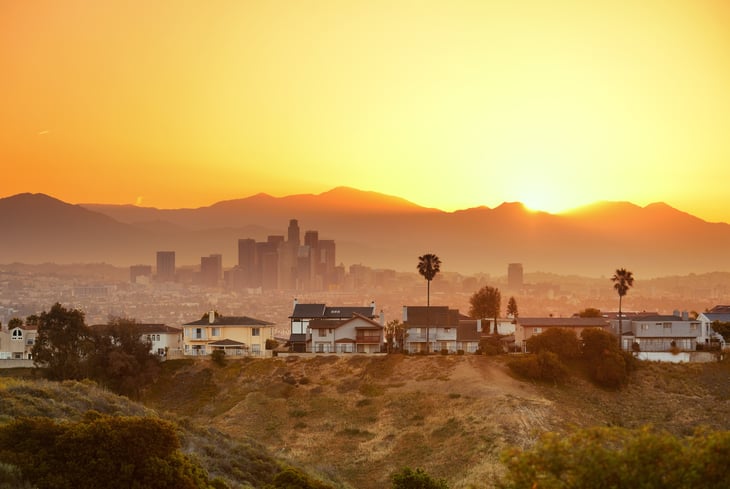
Median AQI: 84
Max AQI: 235
Unhealthy or hazardous days: 142
Moderate days: 164
Good days: 60
Cost of living (compared to average): +18.8%
15. Riverside-San Bernardino-Ontario, CA
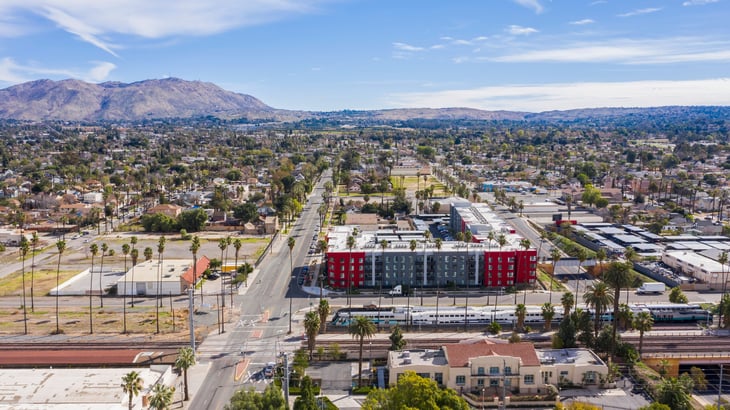
Median AQI: 98
Max AQI: 576
Unhealthy or hazardous days: 176
Moderate days: 152
Good days: 38
Cost of living (compared to average): +7.3%
Methodology & Detailed Findings

The data used in this analysis is from the U.S. Environmental Protection Agency Air Quality System database and the U.S. Bureau of Economic Analysis Regional Price Parities dataset.
To identify the most expensive locations with the worst air quality, researchers looked at the median daily air quality index (AQI) for each metropolitan area in 2020. The AQI is a broad measure of air pollution that takes into account the concentrations of five major air pollutants regulated by the Clean Air Act. Higher AQI values correspond to higher levels of air pollution.
Researchers also included statistics on the maximum AQI observed in 2020 for each location, as well as the total number of unhealthy, moderate, and healthy days. Only locations with a cost of living greater than the national average, as determined by the Bureau of Economic Analysis, were included in the study.


Add a Comment
Our Policy: We welcome relevant and respectful comments in order to foster healthy and informative discussions. All other comments may be removed. Comments with links are automatically held for moderation.