


Editor's Note: This story originally appeared on Porch.
The U.S. real estate market is reaching unprecedented heights. Over the past 18 months, home prices across the nation have shot up to levels unseen since the build-up to the 2008 financial crisis.
For those who were shut out of the real estate market because they were outbid or outpriced, things will not likely get better in the next year, according to Zillow. National projections indicate a decisive upward trend in the Zillow Home Value Index, with some metropolitan areas projecting increases that are more than double the national average.
To determine the real estate markets expected to grow the most in the next year, researchers at Porch analyzed data from Zillow, Redfin, and the U.S. Census Bureau. Its researchers calculated the forecast one-year change in home price, previous one-year change in home price, sale-to-list price ratio, and the home price-to-income ratio. To improve relevance, only metropolitan areas with at least 100,000 residents were included.
Here are the large U.S. real estate markets (population 1 million or more) projected to grow the most over the next year.
15. Tucson, AZ

Forecast one-year change in home price: +18.6%
Previous one-year change in home price: +19.0%
Current median home price: $273,526
Sale-to-list price ratio: 101%
Median household income: $56,169
Home price-to-income ratio: 4.87X
14. Sacramento, CA

Forecast one-year change in home price: +18.7%
Previous one-year change in home price: +17.1%
Current median home price: $516,489
Sale-to-list price ratio: 104%
Median household income: $76,706
Home price-to-income ratio: 6.73X

13. Tampa, FL

Forecast one-year change in home price: +18.8%
Previous one-year change in home price: +17.7%
Current median home price: $276,685
Sale-to-list price ratio: 100%
Median household income: $57,906
Home price-to-income ratio: 4.78X
12. Pittsburgh, PA

Forecast one-year change in home price: +19.8%
Previous one-year change in home price: +15.0%
Current median home price: $190,588
Sale-to-list price ratio: 100%
Median household income: $62,638
Home price-to-income ratio: 3.04X
11. Fresno, CA

Forecast one-year change in home price: +19.8%
Previous one-year change in home price: +16.4%
Current median home price: $321,266
Sale-to-list price ratio: 100%
Median household income: $57,518
Home price-to-income ratio: 5.59X
10. Denver, CO

Forecast one-year change in home price: +20.8%
Previous one-year change in home price: +15.2%
Current median home price: $529,969
Sale-to-list price ratio: 104%
Median household income: $85,641
Home price-to-income ratio: 6.19X
9. Dallas-Fort Worth, TX

Forecast one-year change in home price: +21.1%
Previous one-year change in home price: +14.4%
Current median home price: $297,044
Sale-to-list price ratio: 102%
Median household income: $72,265
Home price-to-income ratio: 4.11X
8. San Francisco, CA

Forecast one-year change in home price: +21.2%
Previous one-year change in home price: +11.6%
Current median home price: $1,255,661
Sale-to-list price ratio: 107%
Median household income: $114,696
Home price-to-income ratio: 10.95X
7. Riverside, CA
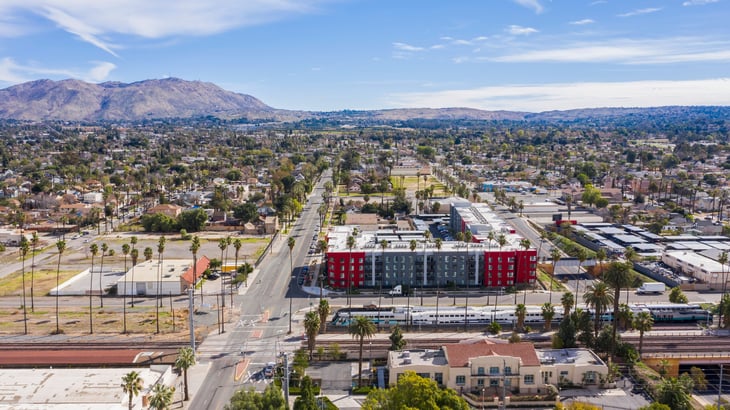
Forecast one-year change in home price: +21.8%
Previous one-year change in home price: +19.0%
Current median home price: $472,569
Sale-to-list price ratio: 102%
Median household income: $70,954
Home price-to-income ratio: 6.66X
6. Las Vegas, NV

Forecast one-year change in home price: +23.3%
Previous one-year change in home price: +12.7%
Current median home price: $339,768
Sale-to-list price ratio: 100%
Median household income: $62,107
Home price-to-income ratio: 5.47X
5. Salt Lake City, UT

Forecast one-year change in home price: +23.5%
Previous one-year change in home price: +20.6%
Current median home price: $486,928
Sale-to-list price ratio: 104%
Median household income: $80,196
Home price-to-income ratio: 6.07X
4. San Jose, CA

Forecast one-year change in home price: +24.5%
Previous one-year change in home price: +11.4%
Current median home price: $1,384,778
Sale-to-list price ratio: 107%
Median household income: $130,865
Home price-to-income ratio: 10.58X
3. San Diego, CA

Forecast one-year change in home price: +24.7%
Previous one-year change in home price: +19.6%
Current median home price: $754,557
Sale-to-list price ratio: 103%
Median household income: $83,985
Home price-to-income ratio: 8.98X
2. Phoenix, AZ

Forecast one-year change in home price: +26.2%
Previous one-year change in home price: +23.5%
Current median home price: $367,484
Sale-to-list price ratio: 102%
Median household income: $67,896
Home price-to-income ratio: 5.41X
1. Austin, TX

Forecast one-year change in home price: +37.1%
Previous one-year change in home price: +30.5%
Current median home price: $458,885
Sale-to-list price ratio: 109%
Median household income: $80,954
Home price-to-income ratio: 5.67X
Detailed Findings & Methodology

At the metro level, there is a positive correlation between the forecast one-year change in home price and the ratio of home price to household income. This means that in already unaffordable real estate markets with high home prices relative to income, prices are projected to continue rising more quickly than average. Standout examples of this trend include Santa Cruz, San Jose, and San Diego in California and Flagstaff, Arizona.
The data used in this analysis is from Zillow, Redfin, and the U.S. Census Bureau’s 2019 American Community Survey. To determine the real estate markets expected to grow the most in the next year, researchers calculated the forecast one-year change in home price. In the event of a tie, the location with the higher previous one-year change in home price was ranked higher. To improve relevance, only metropolitan areas with at least 100,000 residents were included. Additionally, metros were grouped into cohorts based on population size: small (100,000–349,999), midsize (350,000–999,999), and large (1 million or more).
Add a Comment
Our Policy: We welcome relevant and respectful comments in order to foster healthy and informative discussions. All other comments may be removed. Comments with links are automatically held for moderation.