


Editor's Note: This story originally appeared on Commodity.com.
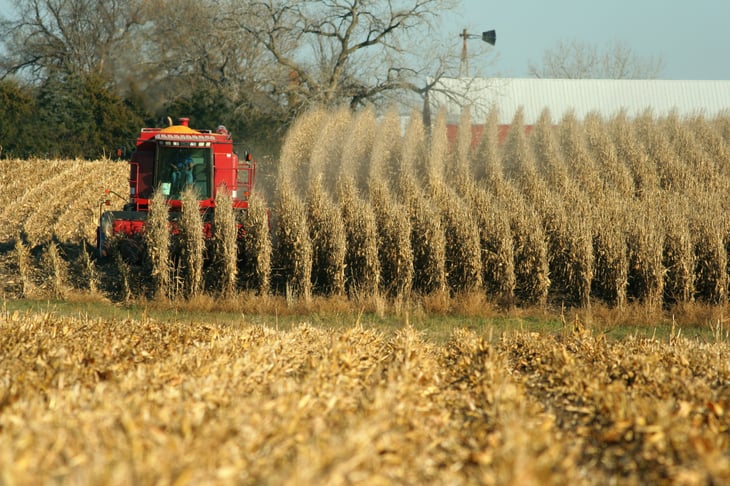
The past few years have been challenging ones for the agriculture industry. The threat of global climate change has continued to produce higher temperatures and more extreme weather events that threaten crops and livestock.
This summer, the U.S. is experiencing serious drought in some of its key agricultural regions in California, the upper Midwest, and the Southeast.
Additionally, trade policies under the Trump administration reduced agricultural exports and incomes while raising costs on imports of key equipment and supplies.
And the COVID-19 pandemic brought additional uncertainty to commodity markets and has continued to disrupt the supply chains that farmers rely on to sell their products.
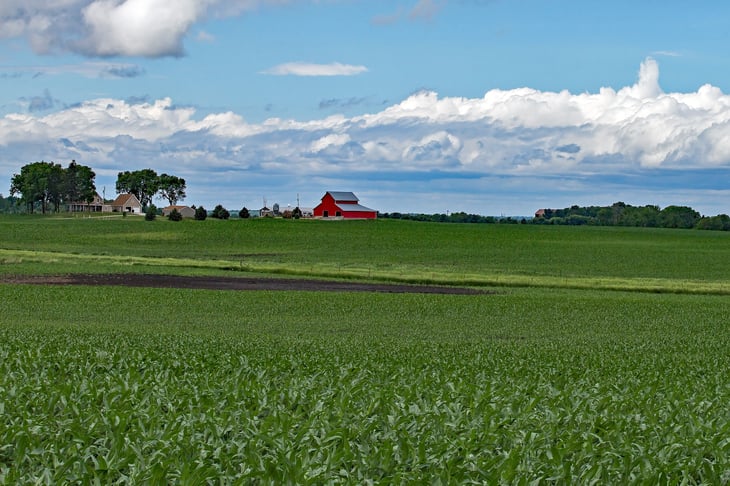
These recent difficulties have made it harder than ever to prosper as a farmer, particularly on smaller-scale farms. But long-term trends suggest that agriculture’s role in the economy has been shifting for much longer.
What has historically been one of America’s most important industries now has a starkly diminished role in terms of job creation and GDP (gross domestic product).
To identify the states most dependent on agriculture, researchers at Commodity.com used data from the U.S. Bureau of Economic Analysis to calculate the percentage of total state GDP accounted for by farming operations in each state.
Here are the state economies that are most dependent on agriculture.
15. Kentucky

Farming share of GDP: 1.06%
Farming share of total employment: 3.21%
Total farming GDP: $2,282,200,000
Total farming employment: 82,641
14. Vermont

Farming share of GDP: 1.13%
Farming share of total employment: 2.11%
Total farming GDP: $385,600,000
Total farming employment: 9,316
13. Wisconsin

Farming share of GDP: 1.25%
Farming share of total employment: 2.31%
Total farming GDP: $4,358,500,000
Total farming employment: 86,560

12. Oklahoma
Farming share of GDP: 1.26%
Farming share of total employment: 3.27%
Total farming GDP: $2,547,100,000
Total farming employment: 76,389
11. Minnesota

Farming share of GDP: 1.27%
Farming share of total employment: 1.97%
Total farming GDP: $4,880,500,000
Total farming employment: 75,401
10. Mississippi

Farming share of GDP: 1.27%
Farming share of total employment: 2.42%
Total farming GDP: $1,478,000,000
Total farming employment: 39,132
9. New Mexico
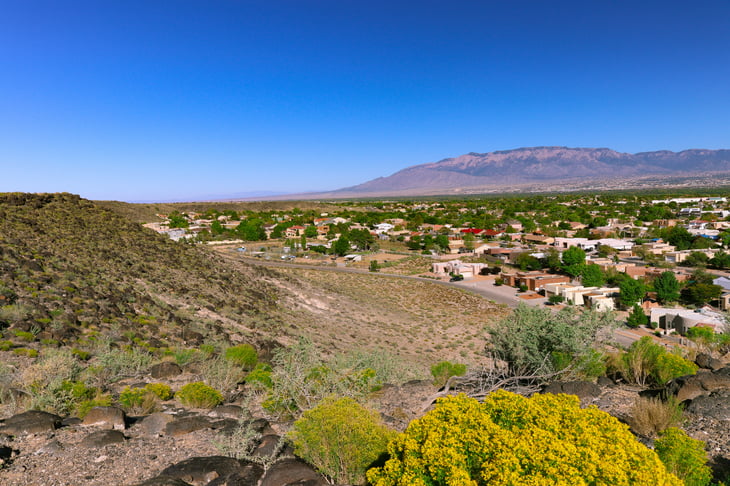
Farming share of GDP: 1.28%
Farming share of total employment: 2.49%
Total farming GDP: $1,347,600,000
Total farming employment: 28,135
8. Wyoming
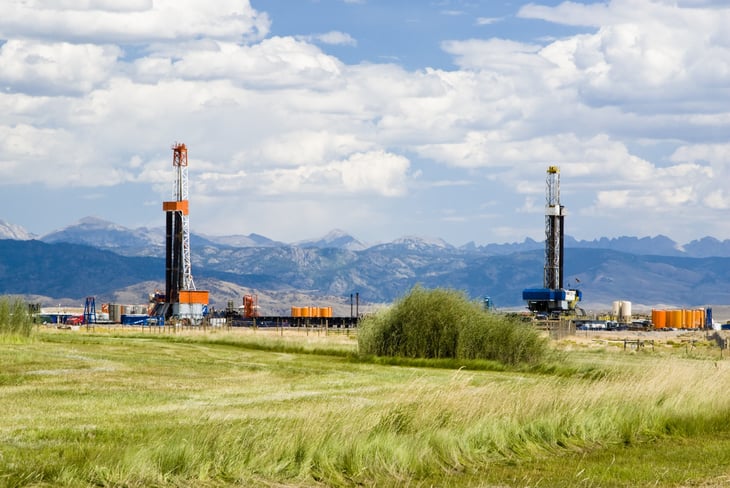
Farming share of GDP: 1.66%
Farming share of total employment: 3.58%
Total farming GDP: $671,800,000
Total farming employment: 14,781
7. Kansas

Farming share of GDP: 2.55%
Farming share of total employment: 3.23%
Total farming GDP: $4,501,000,000
Total farming employment: 62,910
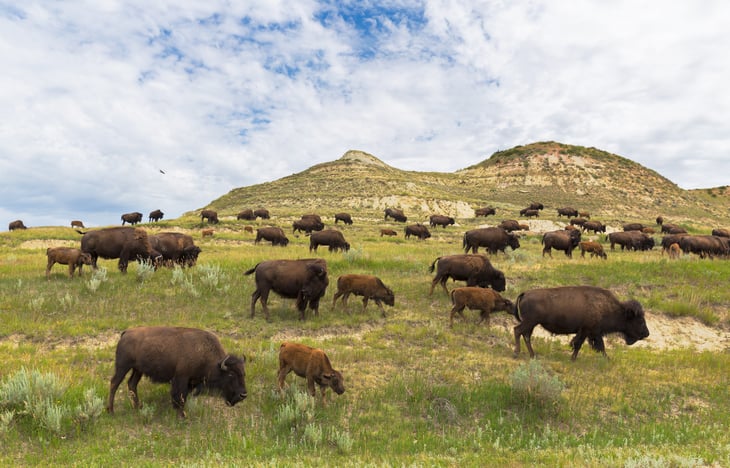
6. Montana

Farming share of GDP: 3.23%
Farming share of total employment: 4.30%
Total farming GDP: $1,711,600,000
Total farming employment: 29,879
5. Idaho
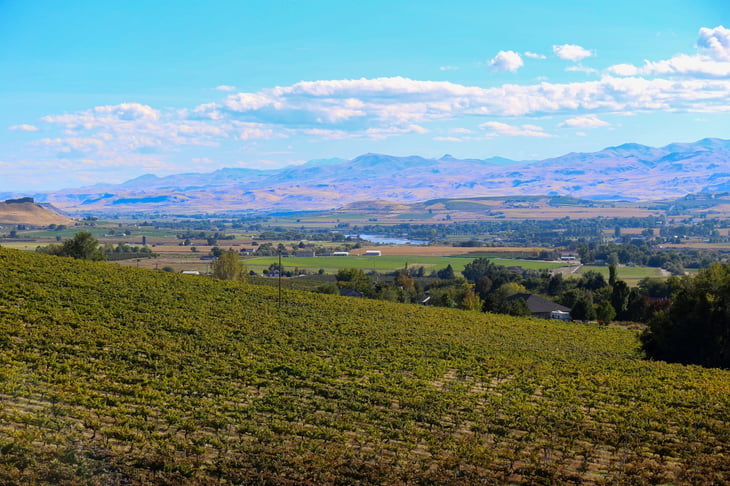
Farming share of GDP: 4.28%
Farming share of total employment: 3.93%
Total farming GDP: $3,583,400,000
Total farming employment: 42,154
4. Iowa
Farming share of GDP: 4.30%
Farming share of total employment: 4.24%
Total farming GDP: $8,374,200,000
Total farming employment: 88,874
3. North Dakota
Farming share of GDP: 4.46%
Farming share of total employment: 4.85%
Total farming GDP: $2,551,300,000
Total farming employment: 28,484
2. Nebraska
Farming share of GDP: 4.62%
Farming share of total employment: 4.07%
Total farming GDP: $6,005,200,000
Total farming employment: 54,700
1. South Dakota
Farming share of GDP: 5.78%
Farming share of total employment: 5.07%
Total farming GDP: $3,174,300,000
Total farming employment: 31,273
Methodology

The data used in this analysis is from the U.S. Bureau of Economic Analysis GDP & Personal Income Regional Data.
To identify the states most dependent on agriculture, researchers calculated the percentage of total state GDP accounted for by farms in each state. Farms include establishments engaged in crop and animal production mainly for food and fiber.
Researchers also calculated the farm industry’s share of total employment, which includes full-time and part-time wage and salary jobs, sole proprietorships, and individual general partners, but not unpaid family workers or volunteers.
Add a Comment
Our Policy: We welcome relevant and respectful comments in order to foster healthy and informative discussions. All other comments may be removed. Comments with links are automatically held for moderation.