


Editor's Note: This story originally appeared on Filterbuy.
For the first two years of COVID-19, the shifting landscape around the pandemic affected travel more than almost any sector of the economy. Concerns about the spread of the coronavirus and changes in travel restrictions and public health guidance led many would-be travelers to hold off on trips.
As a result, industries like air travel and lodging saw much lower than usual demand throughout 2020 and 2021, and closely related businesses like restaurants and arts, entertainment, and recreation facilities also suffered. But according to recent data from the U.S. Travel Association, many indicators like hotel room demand and overall travel spending are at or near pre-pandemic levels.
To determine the states with the biggest drop in travel spending during the pandemic, researchers at Filterbuy calculated the percentage change in air transportation and accommodations spending from 2019 to 2020. In the event of a tie, the state with the greater total change in air transportation and accommodations spending from 2019 to 2020 was ranked higher. The data used in this analysis is from the U.S. Bureau of Economic Analysis’s Personal Consumption Expenditures.
Here are the states with the biggest drop in travel spending during the COVID-19 pandemic.
15. Michigan

Percentage change in travel spending (2019-2020): -56.1%
Total change in travel spending (2019-2020): -$3,083,300,000
Per capita travel spending (2020): $242
Per capita travel spending (2019): $550
14. Oregon

Percentage change in travel spending (2019-2020): -56.3%
Total change in travel spending (2019-2020): -$2,019,100,000
Per capita travel spending (2020): $369
Per capita travel spending (2019): $850
13. Alaska

Percentage change in travel spending (2019-2020): -56.5%
Total change in travel spending (2019-2020): -$572,500,000
Per capita travel spending (2020): $603
Per capita travel spending (2019): $1,385
12. Maryland
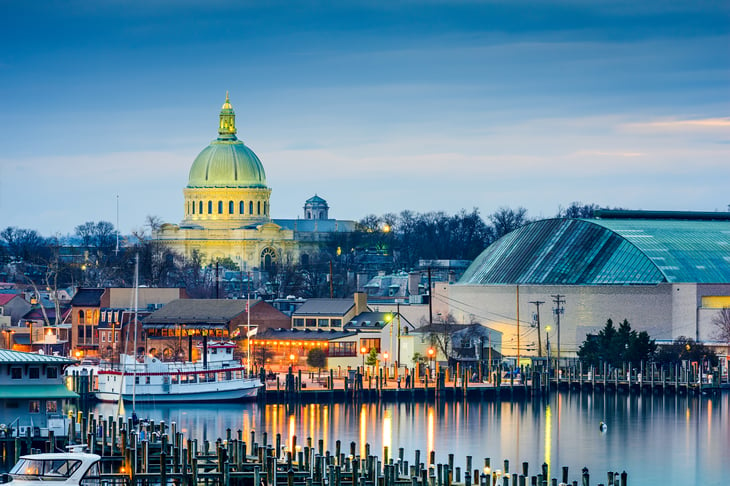
Percentage change in travel spending (2019-2020): -56.8%
Total change in travel spending (2019-2020): -$2,876,200,000
Per capita travel spending (2020): $361
Per capita travel spending (2019): $838
11. Georgia

Percentage change in travel spending (2019-2020): -56.8%
Total change in travel spending (2019-2020): -$5,658,600,000
Per capita travel spending (2020): $402
Per capita travel spending (2019): $939
10. Minnesota

Percentage change in travel spending (2019-2020): -57.3%
Total change in travel spending (2019-2020): -$1,751,400,000
Per capita travel spending (2020): $230
Per capita travel spending (2019): $542
9. Washington

Percentage change in travel spending (2019-2020): -57.4%
Total change in travel spending (2019-2020): -$5,375,100,000
Per capita travel spending (2020): $519
Per capita travel spending (2019): $1,230
8. Virginia

Percentage change in travel spending (2019-2020): -58.4%
Total change in travel spending (2019-2020): -$3,757,900,000
Per capita travel spending (2020): $311
Per capita travel spending (2019): $754
7. Rhode Island

Percentage change in travel spending (2019-2020): -58.9%
Total change in travel spending (2019-2020): -$555,300,000
Per capita travel spending (2020): $366
Per capita travel spending (2019): $890
6. New Jersey

Percentage change in travel spending (2019-2020): -58.9%
Total change in travel spending (2019-2020): -$4,263,100,000
Per capita travel spending (2020): $334
Per capita travel spending (2019): $814
5. Pennsylvania

Percentage change in travel spending (2019-2020): -59.2%
Total change in travel spending (2019-2020): -$4,770,200,000
Per capita travel spending (2020): $258
Per capita travel spending (2019): $630
4. Illinois

Percentage change in travel spending (2019-2020): -60.0%
Total change in travel spending (2019-2020): -$7,281,100,000
Per capita travel spending (2020): $385
Per capita travel spending (2019): $957
3. Connecticut

Percentage change in travel spending (2019-2020): -60.5%
Total change in travel spending (2019-2020): -$2,426,500,000
Per capita travel spending (2020): $446
Per capita travel spending (2019): $1,125
2. Massachusetts

Percentage change in travel spending (2019-2020): -61.8%
Total change in travel spending (2019-2020): -$5,216,300,000
Per capita travel spending (2020): $467
Per capita travel spending (2019): $1,224
1. New York

Percentage change in travel spending (2019-2020): -64.2%
Total change in travel spending (2019-2020): -$14,195,700,000
Per capita travel spending (2020): $409
Per capita travel spending (2019): $1,136
Methodology

The data used in this analysis is from the U.S. Bureau of Economic Analysis’ Personal Consumption Expenditures.
To determine the states with the biggest drop in travel spending during the pandemic, researchers calculated the percentage change in air transportation and accommodations spending from 2019 to 2020. In the event of a tie, the state with the greater total change in air transportation and accommodations spending from 2019 to 2020 was ranked higher.
Add a Comment
Our Policy: We welcome relevant and respectful comments in order to foster healthy and informative discussions. All other comments may be removed. Comments with links are automatically held for moderation.