


Editor's Note: This story originally appeared on HireAHelper.
The U.S. economy today, in some ways, offers the most favorable conditions workers have had in years. The unemployment rate is as low as it has been in two decades, having bounced back from a pandemic-induced spike in 2020. Simultaneously, the wave of departures and job switches now known as the Great Resignation suggests that workers are on the hunt for better jobs.
To recruit and retain employees in a tight labor market, employers are raising wages and offering better benefits and flexible working arrangements.
Amid these labor-friendly conditions, another historic source of worker power may be making a comeback: unions.
Recent union drives at major U.S. employers like Starbucks and Amazon have grabbed headlines. Meanwhile, Congress is currently considering the PRO Act, a major piece of legislation that aims to strengthen unions.
Support for unions is similarly widespread among the general population; a majority of Americans believes that declines in union membership have been bad for the country, and according to the National Labor Relations Board, petitions for union elections nationwide rose by 57% from 2021 to 2022.
Researchers at HireAHelper calculated the percentage of workers who are union members by looking at data from the U.S. Bureau of Labor Statistics 2021 Current Population Survey.
Here are the states with the highest union participation rates.
15. Maine
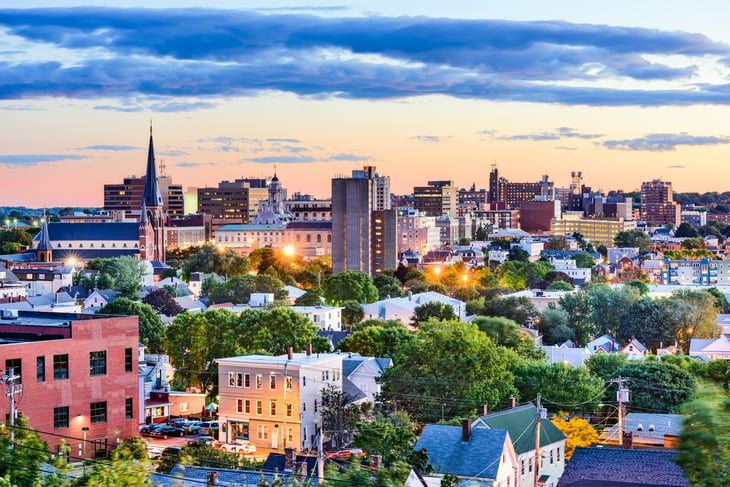
- Percentage of workers who are union members: 12.4%
- Percentage of workers who are represented by unions: 14.7%
- Total workers who are union members: 70,000
- Total workers who are represented by unions: 83,000
14. Massachusetts

- Percentage of workers who are union members: 12.6%
- Percentage of workers who are represented by unions: 13.6%
- Total workers who are union members: 402,000
- Total workers who are represented by unions: 433,000
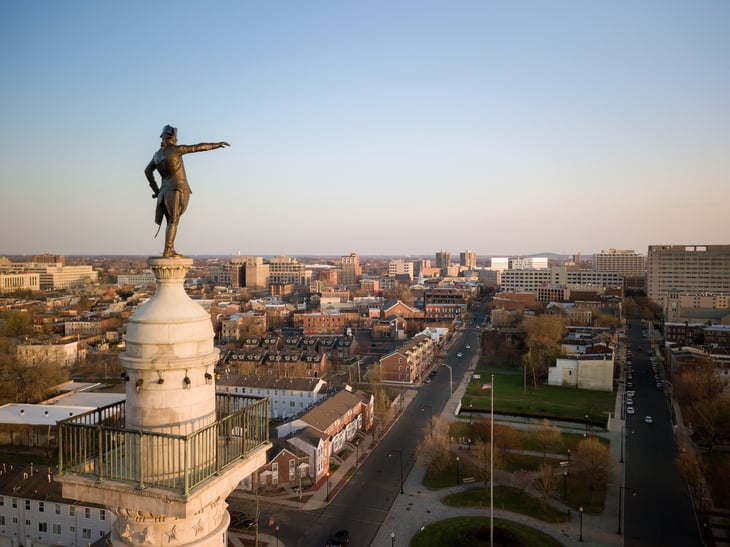
13. Pennsylvania
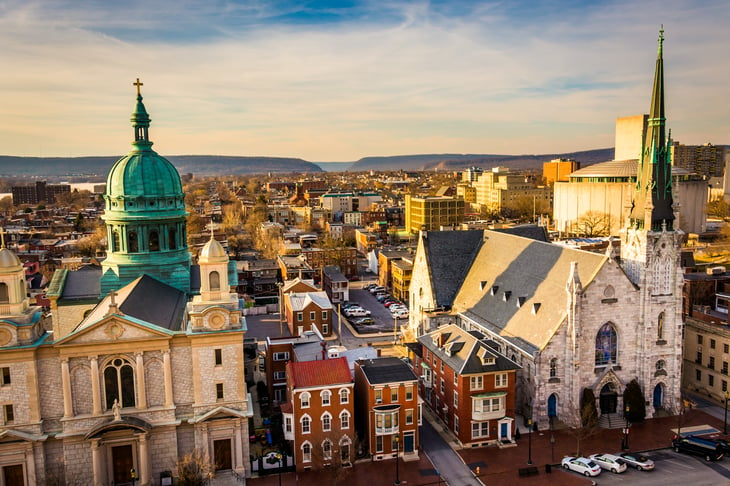
- Percentage of workers who are union members: 12.9%
- Percentage of workers who are represented by unions: 13.6%
- Total workers who are union members: 693,000
- Total workers who are represented by unions: 732,000
12. Michigan
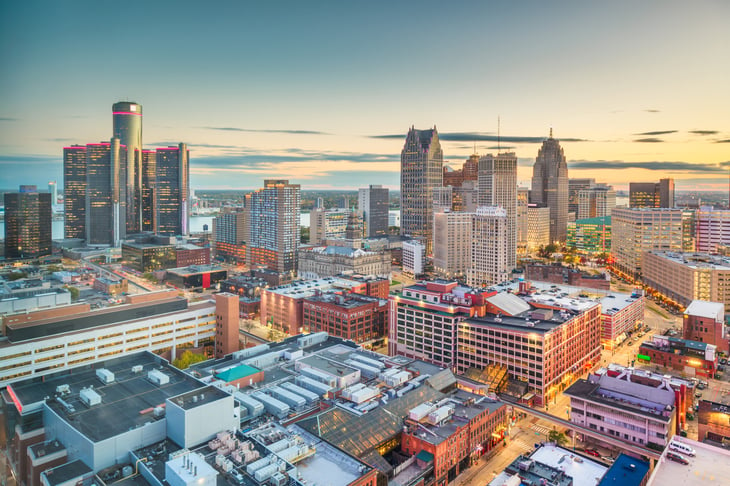
- Percentage of workers who are union members: 13.3%
- Percentage of workers who are represented by unions: 15.3%
- Total workers who are union members: 540,000
- Total workers who are represented by unions: 620,000
11. Illinois

- Percentage of workers who are union members: 13.9%
- Percentage of workers who are represented by unions: 15.2%
- Total workers who are union members: 752,000
- Total workers who are represented by unions: 818,000
10. Connecticut

- Percentage of workers who are union members: 14.6%
- Percentage of workers who are represented by unions: 16.3%
- Total workers who are union members: 223,000
- Total workers who are represented by unions: 248,000
9. Rhode Island

- Percentage of workers who are union members: 15.7%
- Percentage of workers who are represented by unions: 17.4%
- Total workers who are union members: 75,000
- Total workers who are represented by unions: 83,000

8. Alaska
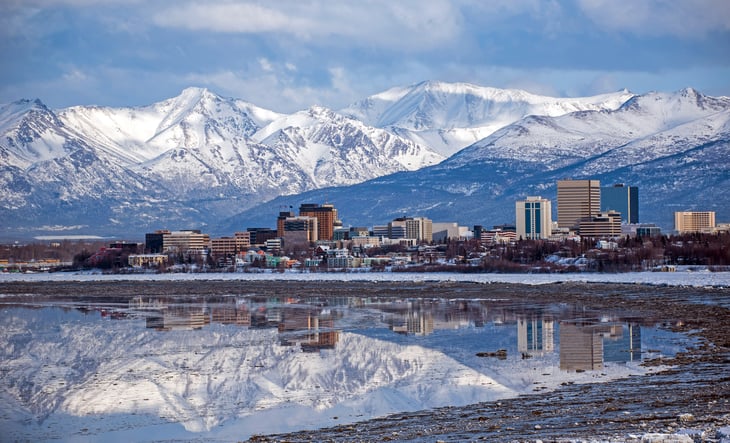
- Percentage of workers who are union members: 15.8%
- Percentage of workers who are represented by unions: 17.2%
- Total workers who are union members: 46,000
- Total workers who are represented by unions: 50,000
7. California

- Percentage of workers who are union members: 15.9%
- Percentage of workers who are represented by unions: 17.8%
- Total workers who are union members: 2,468,000
- Total workers who are represented by unions: 2,757,000
6. Minnesota

- Percentage of workers who are union members: 16.0%
- Percentage of workers who are represented by unions: 17.1%
- Total workers who are union members: 416,000
- Total workers who are represented by unions: 446,000
5. New Jersey
- Percentage of workers who are union members: 16.2%
- Percentage of workers who are represented by unions: 17.9%
- Total workers who are union members: 608,000
- Total workers who are represented by unions: 672,000
4. Oregon

- Percentage of workers who are union members: 17.8%
- Percentage of workers who are represented by unions: 18.8%
- Total workers who are union members: 318,000
- Total workers who are represented by unions: 336,000
3. Washington
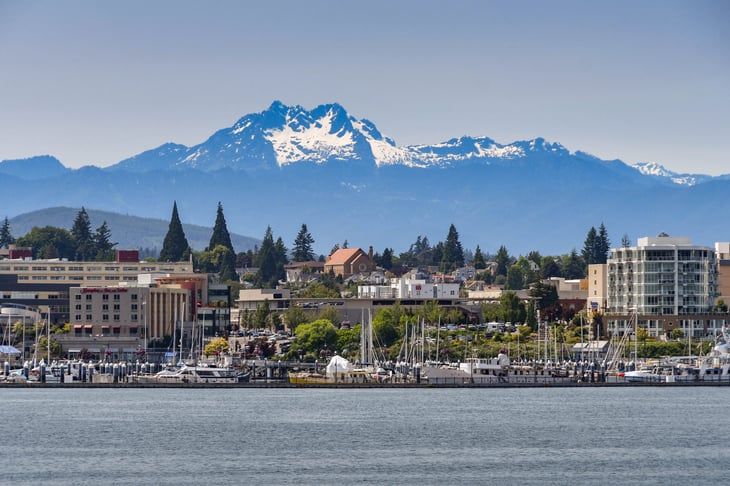
- Percentage of workers who are union members: 19.0%
- Percentage of workers who are represented by unions: 20.0%
- Total workers who are union members: 629,000
- Total workers who are represented by unions: 661,000
2. New York
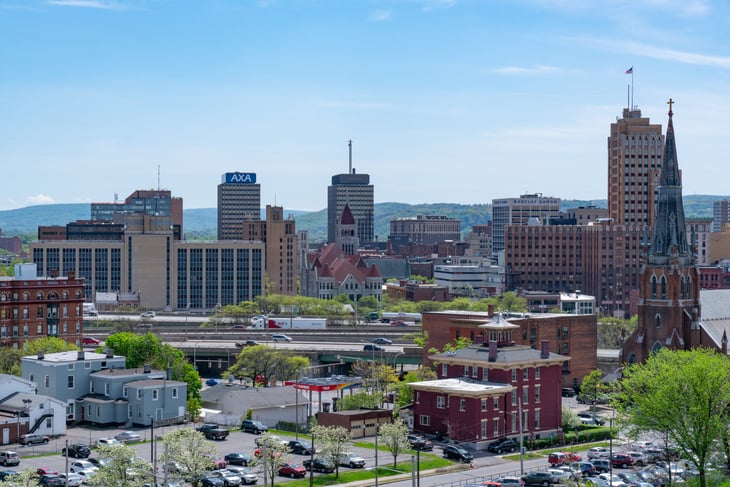
- Percentage of workers who are union members: 22.2%
- Percentage of workers who are represented by unions: 24.1%
- Total workers who are union members: 1,729,000
- Total workers who are represented by unions: 1,869,000
1. Hawaii
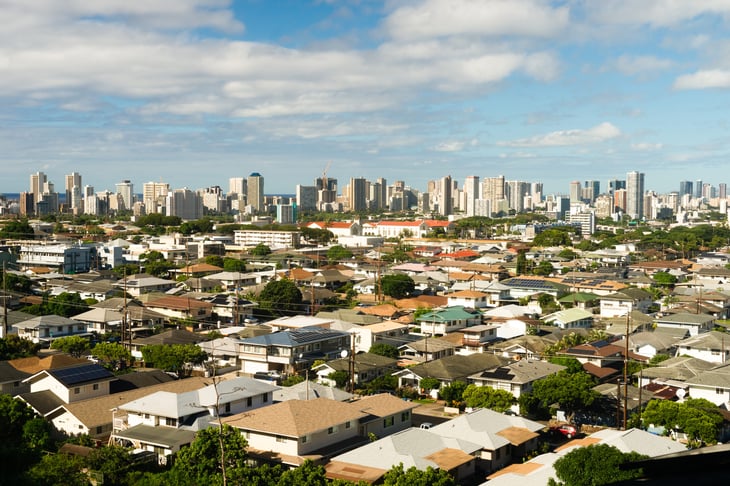
- Percentage of workers who are union members: 22.4%
- Percentage of workers who are represented by unions: 24.1%
- Total workers who are union members: 121,000
- Total workers who are represented by unions: 131,000
Methodology

The data used in this analysis is from the U.S. Bureau of Labor Statistics 2021 Current Population Survey. To determine the states with the highest union participation rates, researchers calculated the percentage of workers who are union members. In the event of a tie, the state with the greater percentage of workers who are represented by unions was ranked higher. For clarification, “workers who are represented by unions” includes both union members who have the right to vote on union business, as well as workers who report no union affiliation but whose jobs are covered by a union contract.
Only the 100 largest metropolitan areas with available data were considered in this analysis.
Add a Comment
Our Policy: We welcome relevant and respectful comments in order to foster healthy and informative discussions. All other comments may be removed. Comments with links are automatically held for moderation.