


Editor's Note: This story originally appeared on Stessa.
Amid a historic run of inflation over the last year, the cost of housing — especially rent — has been one of the most significant pressures on household finances. Renters in many markets are seeing increases of 20% or more as they sign new leases, and, with the nationwide rental vacancy rate at just 5.6%, renters have few alternatives to find more affordable options.
No segment of the rental market has been spared the cost of rising rents, from singles or couples in a studio or one-bedroom unit to families renting a three- or four-bedroom home. According to data from the U.S. Department of Housing and Urban Development, units of all sizes saw price increases of greater than 10% for the median unit between 2019 and 2022.
To determine the locations where rents have risen the most, our researchers calculated the percentage change in median rent from 2019 to 2022. In the event of a tie, the location with the higher total change in median rent from 2019 to 2022 was ranked higher. The data used in this analysis is from the U.S. Department of Housing and Urban Development and the U.S. Census Bureau.
Here are the U.S. metropolitan areas where rents have risen the most.
15. Nashville-Davidson-Murfreesboro-Franklin, TN

- Percentage change in median rent (2019-2022): +16.1%
- Total change in median rent (2019-2022): +$196
- Median rent (2022): $1,412
- Median rent (2019): $1,216
14. Atlanta-Sandy Springs-Alpharetta, GA

- Percentage change in median rent (2019-2022): +16.1%
- Total change in median rent (2019-2022): +$208
- Median rent (2022): $1,498
- Median rent (2019): $1,290
13. New York-Newark-Jersey City, NY-NJ-PA
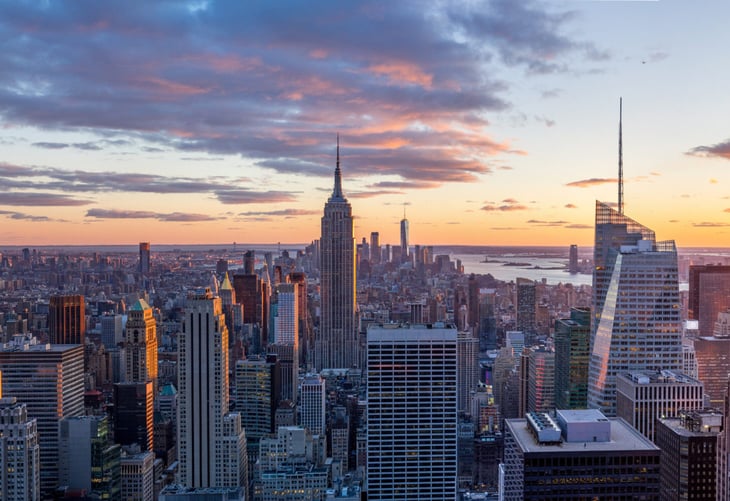
- Percentage change in median rent (2019-2022): +16.4%
- Total change in median rent (2019-2022): +$305
- Median rent (2022): $2,160
- Median rent (2019): $1,855
12. San Diego-Chula Vista-Carlsbad, CA
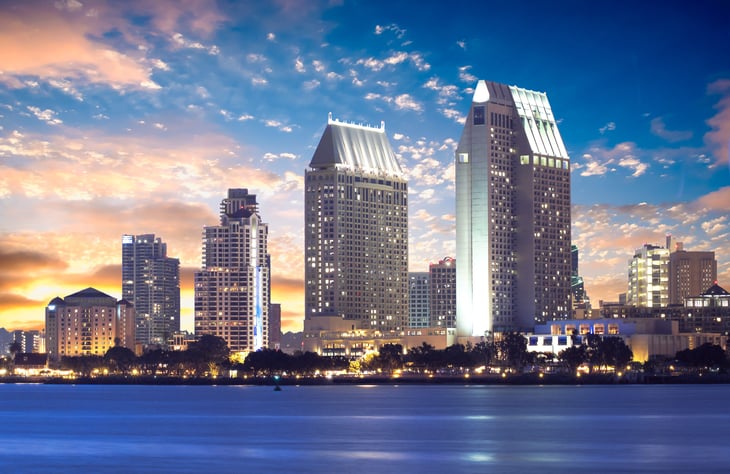
- Percentage change in median rent (2019-2022): +16.8%
- Total change in median rent (2019-2022): +$363
- Median rent (2022): $2,530
- Median rent (2019): $2,167
11. Providence-Warwick, RI-MA

- Percentage change in median rent (2019-2022): +17.9%
- Total change in median rent (2019-2022): +$209
- Median rent (2022): $1,376
- Median rent (2019): $1,167
10. Fresno, CA
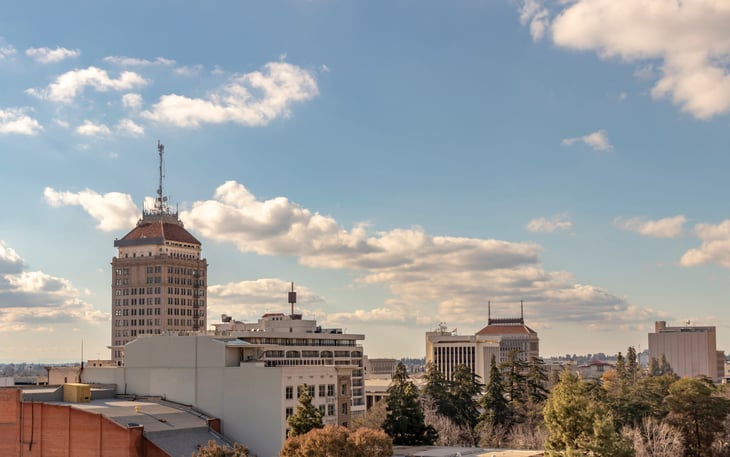
- Percentage change in median rent (2019-2022): +19.3%
- Total change in median rent (2019-2022): +$216
- Median rent (2022): $1,337
- Median rent (2019): $1,121
9. Portland-Vancouver-Hillsboro, OR-WA

- Percentage change in median rent (2019-2022): +19.4%
- Total change in median rent (2019-2022): +$314
- Median rent (2022): $1,932
- Median rent (2019): $1,618
8. Tampa-St. Petersburg-Clearwater, FL
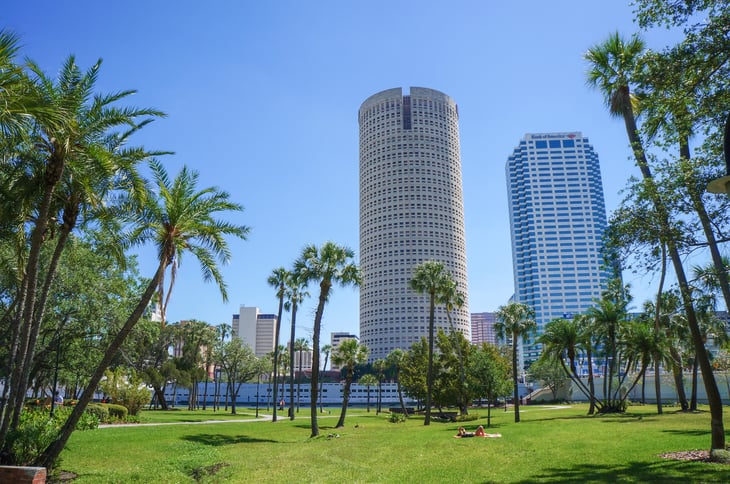
- Percentage change in median rent (2019-2022): +20.0%
- Total change in median rent (2019-2022): +$252
- Median rent (2022): $1,511
- Median rent (2019): $1,259
7. Orlando-Kissimmee-Sanford, FL
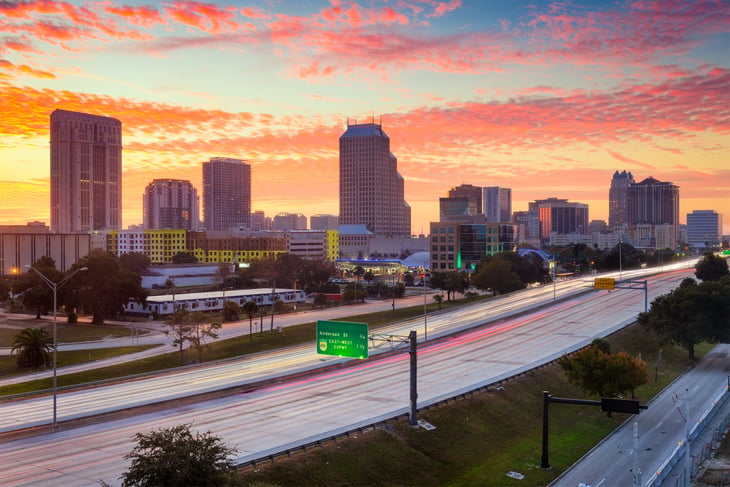
- Percentage change in median rent (2019-2022): +20.3%
- Total change in median rent (2019-2022): +$281
- Median rent (2022): $1,663
- Median rent (2019): $1,382
6. Riverside-San Bernardino-Ontario, CA
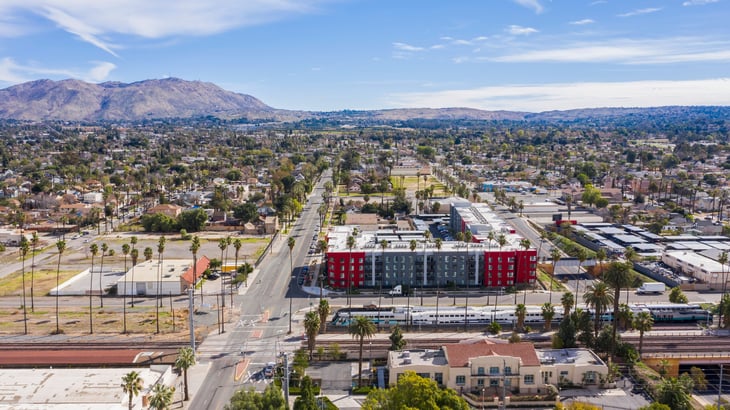
- Percentage change in median rent (2019-2022): +21.6%
- Total change in median rent (2019-2022): +$327
- Median rent (2022): $1,842
- Median rent (2019): $1,515
5. Jacksonville, FL

- Percentage change in median rent (2019-2022): +22.0%
- Total change in median rent (2019-2022): +$255
- Median rent (2022): $1,414
- Median rent (2019): $1,159
4. Phoenix-Mesa-Chandler, AZ
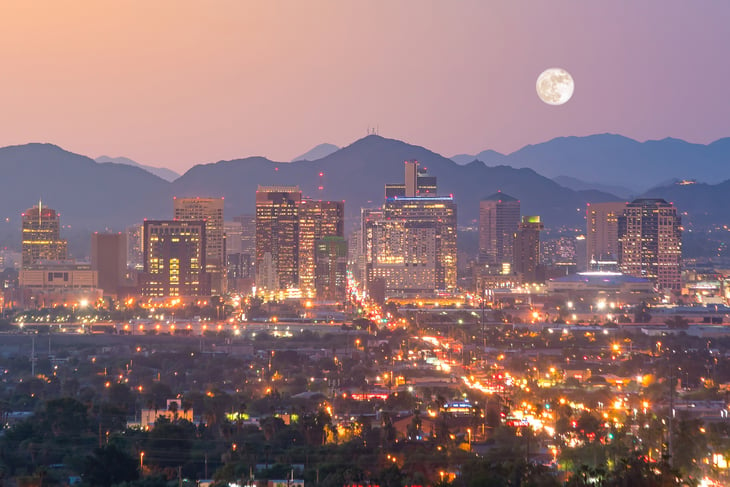
- Percentage change in median rent (2019-2022): +22.3%
- Total change in median rent (2019-2022): +$283
- Median rent (2022): $1,553
- Median rent (2019): $1,270
3. Salt Lake City, UT
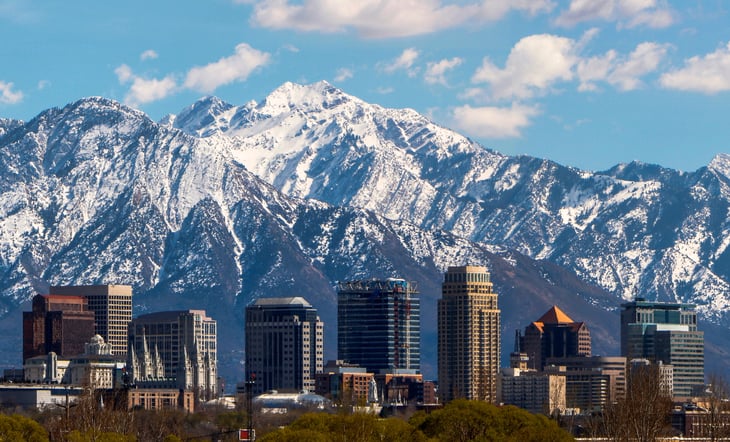
- Percentage change in median rent (2019-2022): +24.6%
- Total change in median rent (2019-2022): +$291
- Median rent (2022): $1,475
- Median rent (2019): $1,184
2. Las Vegas-Henderson-Paradise, NV
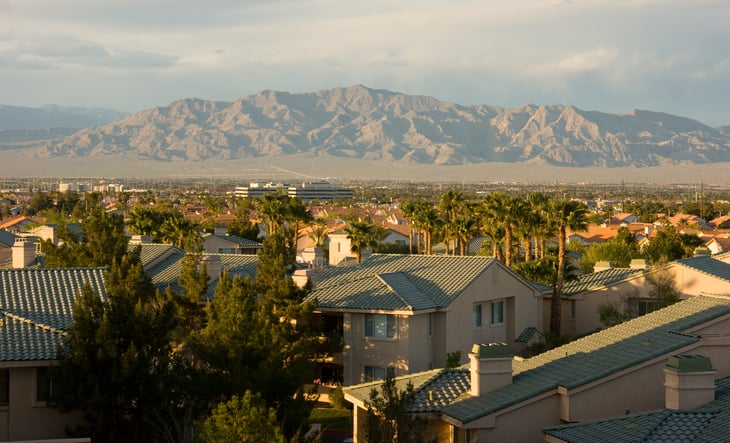
- Percentage change in median rent (2019-2022): +24.8%
- Total change in median rent (2019-2022): +$295
- Median rent (2022): $1,485
- Median rent (2019): $1,190
1. Sacramento-Roseville-Folsom, CA

- Percentage change in median rent (2019-2022): +25.3%
- Total change in median rent (2019-2022): +$369
- Median rent (2022): $1,830
- Median rent (2019): $1,461
Methodology

The data used in this analysis is from the U.S. Department of Housing and Urban Development’s (HUD) 50% Rent Estimates and the U.S. Census Bureau’s American Community Survey. To determine the locations where rents have risen the most, researchers calculated the percentage change in median rent from 2019 to 2022. In the event of a tie, the location with the higher total change in median rent from 2019 to 2022 was ranked higher.
For each location, median rent was estimated using a combination of HUD’s median rent estimates by unit size and data on the number of renter-occupied households by unit size from the U.S. Census. To improve relevance, only metropolitan areas with at least 100,000 residents were included. Additionally, metros were grouped into cohorts based on population size: small (100,000 – 349,999), midsize (350,000 – 999,999), and large (1,000,000 or more).
Add a Comment
Our Policy: We welcome relevant and respectful comments in order to foster healthy and informative discussions. All other comments may be removed. Comments with links are automatically held for moderation.