


This story originally appeared on LawnStarter.
What does it take to live a good life? Happiness, liberty and water.
Humans can last up to 21 days without food but barely make it to Day 3 without H2O. That’s because our bodies are made up of up to 75% water. Our food supply, schools, homes, and businesses also depend on a fresh supply of this life-giving liquid.
But water quality varies across America’s cities. Do you know how fresh the water comes out of your tap compared with other consumers’?
LawnStarter ranked the best cities for water quality by comparing the 200 biggest U.S. cities based on several key factors — from consumers’ overall satisfaction with their water to the number of water quality violations to the share of homes lacking basic plumbing.
Check out the best cities for water quality next, followed by our methodology and data sources.
1. Cary, NC

Overall score: 88.339
Consumer satisfaction rank: N/A
Compliance rank: 157
Infrastructure vulnerability rank: 2
2. Winston-Salem, NC

Overall score: 85.504
Consumer satisfaction rank: 2
Compliance rank: 3
Infrastructure vulnerability rank: 126
3. Yonkers, NY
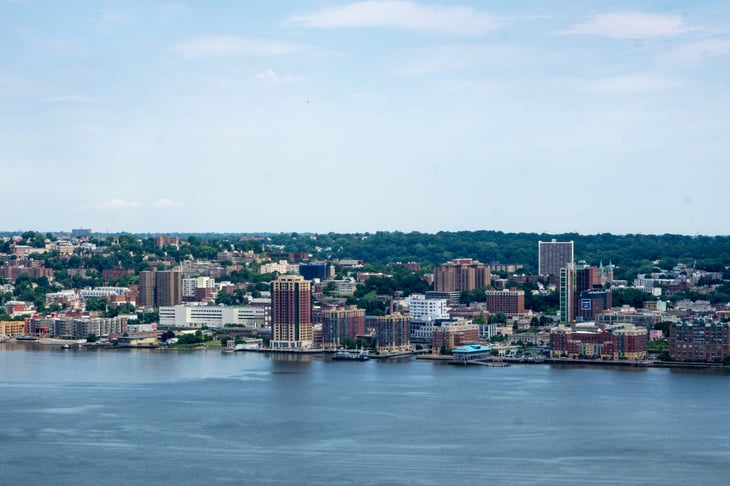
Overall score: 84.902
Consumer satisfaction rank: N/A
Compliance rank: 157
Infrastructure vulnerability rank: 26

4. Bellevue, WA
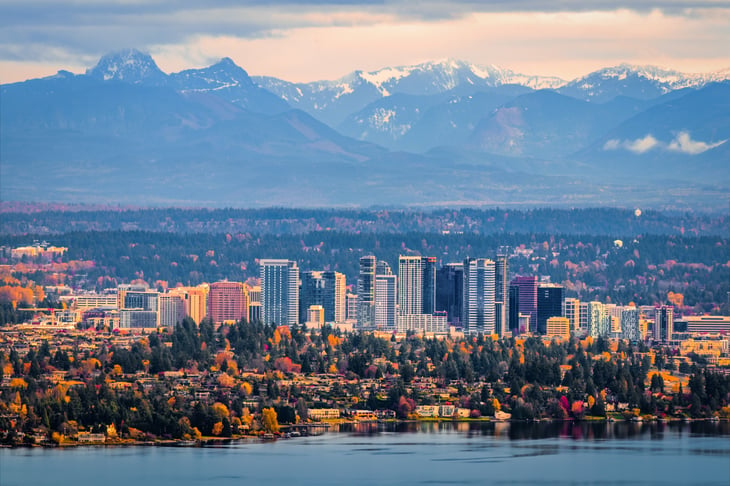
Overall score: 84.757
Consumer satisfaction rank: 6
Compliance rank: 6
Infrastructure vulnerability rank: 50
5. Clarksville, TN
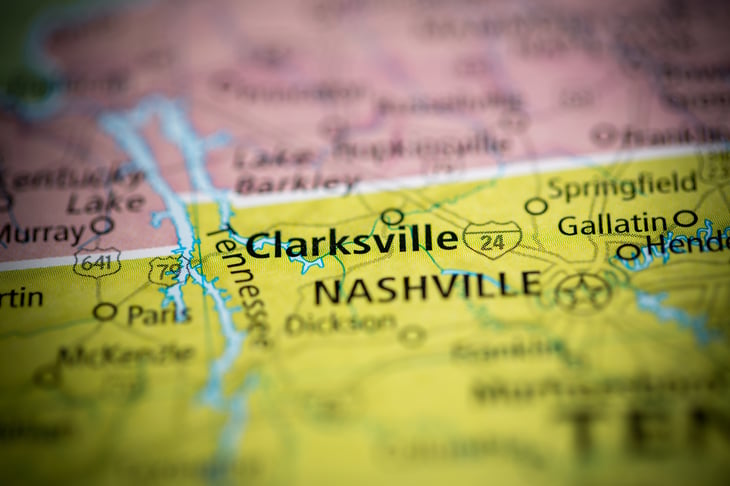
Overall score: 84.611
Consumer satisfaction rank: 11
Compliance rank: 20
Infrastructure vulnerability rank: 16
6. Arlington, VA

Overall score: 84.395
Consumer satisfaction rank: 18
Compliance rank: 17
Infrastructure vulnerability rank: 8
7. Murfreesboro, TN
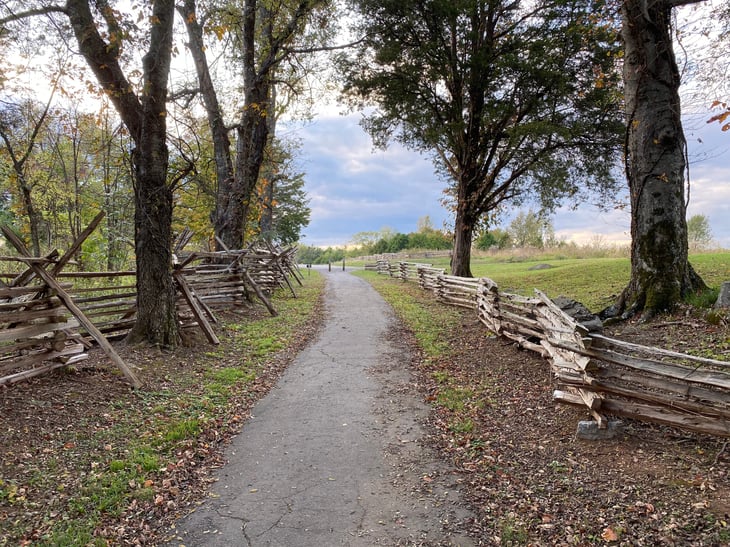
Overall score: 84.306
Consumer satisfaction rank: N/A
Compliance rank: 157
Infrastructure vulnerability rank: 21
8. Sioux Falls, SD

Overall score: 83.985
Consumer satisfaction rank: 19
Compliance rank: 18
Infrastructure vulnerability rank: 3
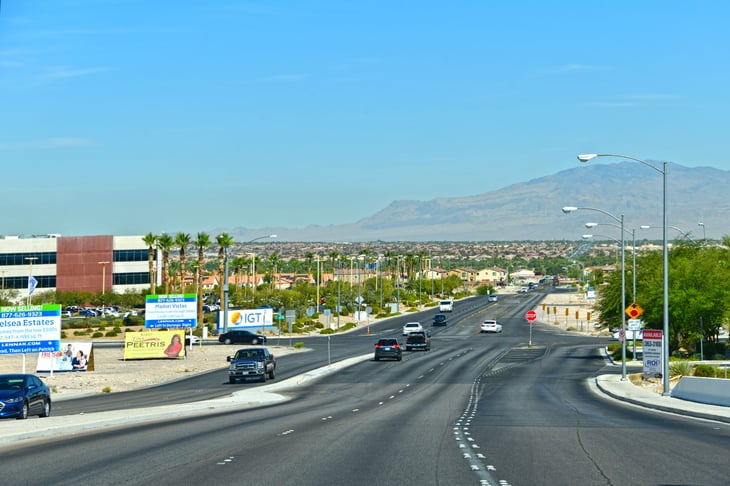
9. North Las Vegas, NV

Overall score: 83.873
Consumer satisfaction rank: N/A
Compliance rank: 157
Infrastructure vulnerability rank: 34
10. Frisco, TX
Overall score: 83.685
Consumer satisfaction rank: 1
Compliance rank: 1
Infrastructure vulnerability rank: 151
11. Spokane, WA

Overall score: 83.533
Consumer satisfaction rank: 14
Compliance rank: 11
Infrastructure vulnerability rank: 33
12. Paterson, NJ

Overall score: 83.479
Consumer satisfaction rank: N/A
Compliance rank: 157
Infrastructure vulnerability rank: 59
13. Grand Rapids, MI

Overall score: 83.172
Consumer satisfaction rank: 28
Compliance rank: 30
Infrastructure vulnerability rank: 11
14. Paradise, NV (tie)

Overall score: 83.119
Consumer satisfaction rank: N/A
Compliance rank: 157
Infrastructure vulnerability rank: 34

14. Spring Valley, NV (tie)
Overall score: 83.119
Consumer satisfaction rank: N/A
Compliance rank: 157
Infrastructure vulnerability rank: 34
14. Sunrise Manor, NV (tie)

Overall score: 83.119
Consumer satisfaction rank: N/A
Compliance rank: 157
Infrastructure vulnerability rank: 34
14. Enterprise, NV (tie)
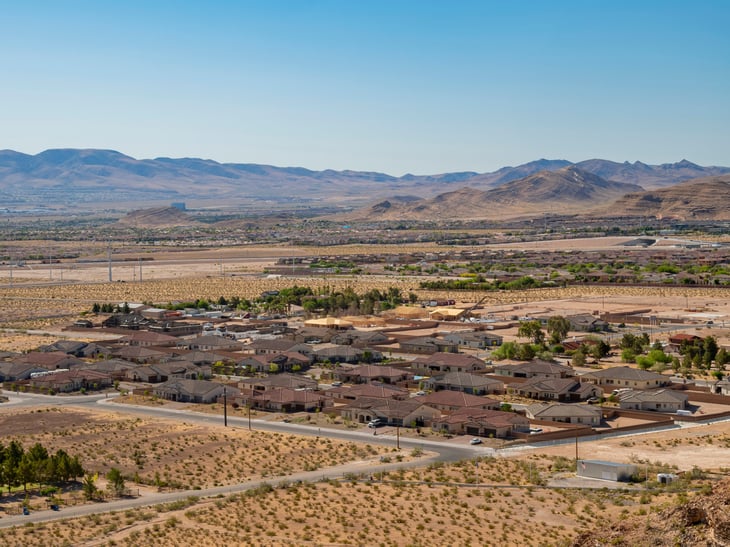
Overall score: 83.119
Consumer satisfaction rank: N/A
Compliance rank: 157
Infrastructure vulnerability rank: 34
18. Midland, TX

Overall score: 83.095
Consumer satisfaction rank: N/A
Compliance rank: 157
Infrastructure vulnerability rank: 68
Methodology

We ranked the 200 most populated U.S. cities in descending order — from best to worst — based on their overall scores, averaged across all the metrics listed below.
- Satisfaction with Overall Water Quality
- Satisfaction with Drinking Water Quality and Accessibility
- Total Water Quality Violations
- Increase in Water Quality Violations
- Share of Homes Lacking Plumbing or Kitchen Facilities
- Share of Homes with Sewage Disposal Breakdowns in Last 3 Months
- Natural Hazards Index Score
A rank of “N/A” in a particular category indicates a lack of data for all metrics in that category. In such cases, the city’s overall score is its average across all metrics for which data were available.
The city that earned the highest overall score — out of a possible 100 points — was ranked No. 1, or “best.”
Limitations:
- The U.S. Environmental Protection Agency requires local water suppliers to publish a water quality report every year by July 1. However, these reports are not available for every city or from every supplier on the EPA’s Consumer Confidence Reports (CCR) database. Absent this data and other official sources, LawnStarter relied instead on consumer satisfaction survey data from Numbeo as a substitute measure of quality.
- According to the EPA, its Safe Drinking Water Information System (SDWIS) database reports all historical water quality violations up to the most recent quarter. However, some data appears to be cleared out periodically, though the frequency and specific reasons for doing so are unclear. Results cannot be filtered to display only violations reported in a particular quarter.
Sources: County Health Rankings & Roadmaps, National Center for Disaster Preparedness, Numbeo, U.S. Census Bureau, and U.S. Environmental Protection Agency
Add a Comment
Our Policy: We welcome relevant and respectful comments in order to foster healthy and informative discussions. All other comments may be removed. Comments with links are automatically held for moderation.