


Editor's Note: This story originally appeared on LawnStarter.
Farming and ranching aren’t the most glamorous jobs — you’re up before sunrise tilling the soil and milking the cows, and you work 365 days a year. Despite the rigorous work schedule, agriculture is among the most rewarding and essential professions.
But where do you have the highest chance of successfully starting a “Green Acres” style of life?
LawnStarter compared the 50 U.S. states across 42 key metrics to rank 2021’s Best States to Start a Farm or Ranch.
We looked for states with existing farm communities to indicate viability, good infrastructure, and a suitable climate. We also compared the states based on overhead and ROI potential.
See which states are best for getting your hands dirty next, followed by our methodology.
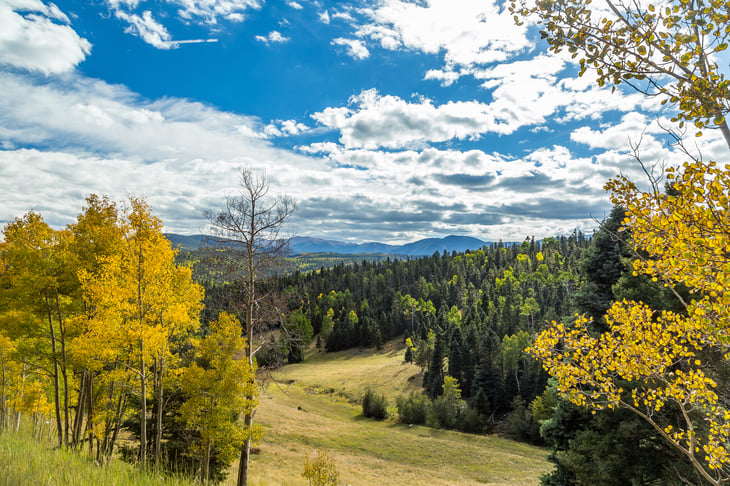
1. Montana
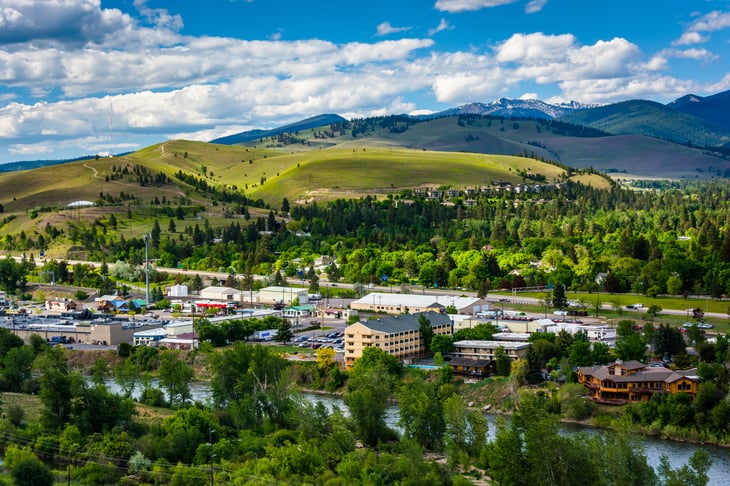
Overall Score: 59.72
Viability Rank: 9
Infrastructure Rank: 7
Climate Rank: 42
Environmental Hazards Rank: 6
Personnel Rank: 9
Costs Rank: 4
ROI Potential Rank: 15
2. Kansas

Overall Score: 58.78
Viability Rank: 5
Infrastructure Rank: 1
Climate Rank: 40
Environmental Hazards Rank: 9
Personnel Rank: 12
Costs Rank: 22
ROI Potential Rank: 32

3. North Dakota
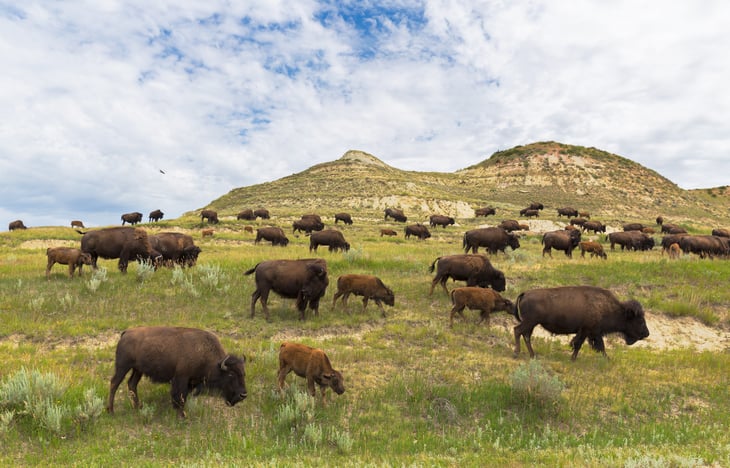
Overall Score: 57.35
Viability Rank: 2
Infrastructure Rank: 23
Climate Rank: 46
Environmental Hazards Rank: 2
Personnel Rank: 10
Costs Rank: 15
ROI Potential Rank: 13
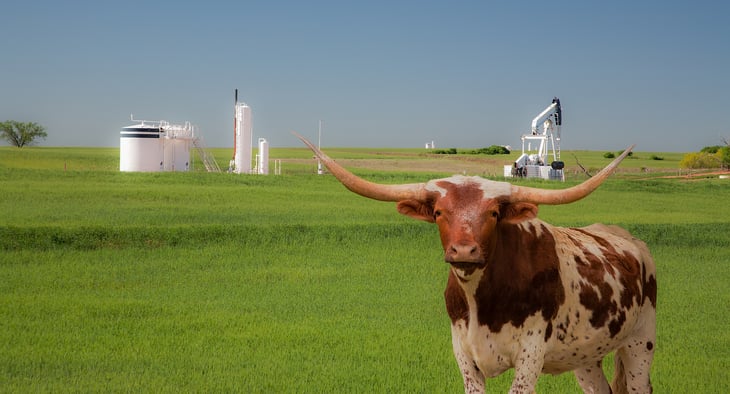
4. Texas
Overall Score: 57.32
Viability Rank: 1
Infrastructure Rank: 6
Climate Rank: 48
Environmental Hazards Rank: 48
Personnel Rank: 24
Costs Rank: 20
ROI Potential Rank: 12
5. Oklahoma
Overall Score: 57.04
Viability Rank: 7
Infrastructure Rank: 9
Climate Rank: 41
Environmental Hazards Rank: 20
Personnel Rank: 19
Costs Rank: 6
ROI Potential Rank: 33
6. South Dakota
Overall Score: 56.36
Viability Rank: 6
Infrastructure Rank: 5
Climate Rank: 47
Environmental Hazards Rank: 5
Personnel Rank: 7
Costs Rank: 26
ROI Potential Rank: 24
7. Iowa
Overall Score: 56.06
Viability Rank: 3
Infrastructure Rank: 2
Climate Rank: 28
Environmental Hazards Rank: 17
Personnel Rank: 5
Costs Rank: 45
ROI Potential Rank: 20
8. Kentucky
Overall Score: 55.07
Viability Rank: 10
Infrastructure Rank: 8
Climate Rank: 8
Environmental Hazards Rank: 28
Personnel Rank: 18
Costs Rank: 17
ROI Potential Rank: 18
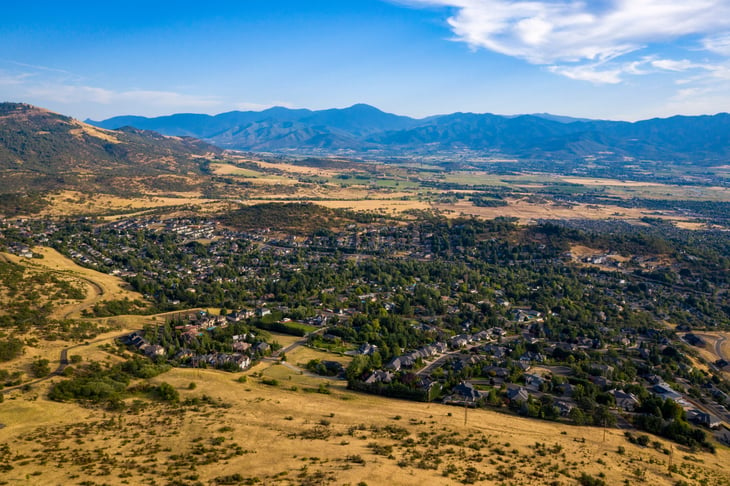
9. Colorado

Overall Score: 54.48
Viability Rank: 16
Infrastructure Rank: 25
Climate Rank: 20
Environmental Hazards Rank: 21
Personnel Rank: 25
Costs Rank: 9
ROI Potential Rank: 10
10. Wyoming

Overall Score: 54.41
Viability Rank: 18
Infrastructure Rank: 16
Climate Rank: 38
Environmental Hazards Rank: 7
Personnel Rank: 27
Costs Rank: 2
ROI Potential Rank: 17
11. Nebraska
Overall Score: 54.34
Viability Rank: 8
Infrastructure Rank: 4
Climate Rank: 45
Environmental Hazards Rank: 4
Personnel Rank: 6
Costs Rank: 46
ROI Potential Rank: 16
12. Arkansas

Overall Score: 54.26
Viability Rank: 20
Infrastructure Rank: 27
Climate Rank: 23
Environmental Hazards Rank: 30
Personnel Rank: 8
Costs Rank: 10
ROI Potential Rank: 4
13. New Mexico
Overall Score: 53.17
Viability Rank: 17
Infrastructure Rank: 47
Climate Rank: 30
Environmental Hazards Rank: 10
Personnel Rank: 13
Costs Rank: 3
ROI Potential Rank: 11
14. Oregon
Overall Score: 53.08
Viability Rank: 23
Infrastructure Rank: 21
Climate Rank: 19
Environmental Hazards Rank: 29
Personnel Rank: 4
Costs Rank: 27
ROI Potential Rank: 5
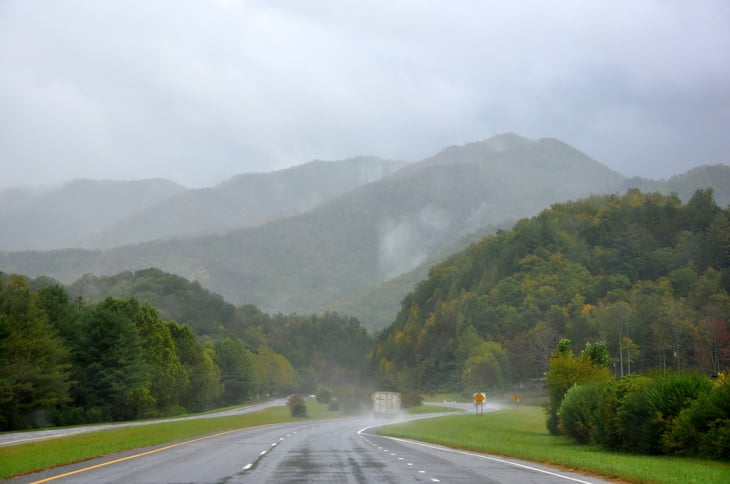
15. Tennessee
Overall Score: 52.88
Viability Rank: 11
Infrastructure Rank: 12
Climate Rank: 13
Environmental Hazards Rank: 44
Personnel Rank: 43
Costs Rank: 13
ROI Potential Rank: 34
Methodology

We ranked the 50 U.S. states (excluding the District of Columbia) from best (No. 1) to worst (No. 50) based on their overall scores (out of 100 possible points), averaged across all the weighted metrics listed below.
- Farmland Area per State Area
- Increase in Farmland Area Over Past Year
- Number of Farms per State Area
- Increase in Number of Farms in Past Year
- Share of Family-Owned Farms
- Average Farm Acreage
- Total Cropland Area
- Total Grassland Pasture Area
- Number of USDA-Approved Slaughter and Rendering Establishments
- CSAs (Community Supported Agriculture) per 100,000 Residents
- Population Density in Rural Areas
- Land Used for Rural Transportation
- Road Quality (Share of Major Roads in Poor or Mediocre Condition)
- Water Quality (Total Number of Violations in Past Year)
- Air Quality (Total Number of Violations in Past Year)
- Phone Coverage
- Potential for Solar Power (Index)
- Potential for Wind Power (Index)
- Share of Electricity from Renewable Sources
- Share of Farms with Internet Access
- Rural Health Clinics per 1,000 Square Miles
- Number of Critical Access Hospitals
- Average Amount of Sunshine
- Average Monthly Precipitation (in Inches)
- Yearly Average Number of Very Hot Days (90 Degrees F or Higher)
- Yearly Average Number of Very Cold Days (32 Degrees F or Lower)
- Toxic Chemicals Release (per Square Mile)
- Risk-Screening Environmental Indicator Score
- Natural Hazards Index
- Farm Workers per 100,000 Residents
- Average Per-Acre Cost of Farmland
- Yearly Average Increase in Per-Acre Farmland
- Per-Acre Farmland Rental Rate
- Yearly Average Increase in Per-Acre Farmland Rental Rate
- Property Taxes
- Average Per-Farm Annual Production Expenses
- Cost of Living Index
- Annual Farmland Returns
- Average Per-Farm Annual Income
- Average Per-Farm Net Cash Annual Income
- Average Per-Farm Annual Receipts from Federal Programs
- Total Annual Market Value of Agricultural Products Sold
Sources: AcreTrader, National Center for Disaster Preparedness, National Oceanic and Atmospheric Administration, National Transportation Research Nonprofit (TRIP), Nebraska Department of Environment & Energy, Rural Health Information Hub, Tax Foundation, U.S. Bureau of Labor Statistics, U.S. Census Bureau, U.S. Department of Agriculture, U.S. Department of Energy, U.S. Energy Information Administration, U.S. Environmental Protection Agency, WhistleOut, and World Population Review.
Add a Comment
Our Policy: We welcome relevant and respectful comments in order to foster healthy and informative discussions. All other comments may be removed. Comments with links are automatically held for moderation.