


This story originally appeared on CoPilot.
Crime in the U.S. has trended downward since the early 1990s, and new data from the University of Pennsylvania suggests that the COVID-19 pandemic has caused these numbers to drop even further across the nation’s largest cities.
Since the onset of the pandemic, property crime, violent crime, and drug crime all experienced double-digit percentage declines when compared with averages over the previous five-year period — a trend attributed to more residents staying home.
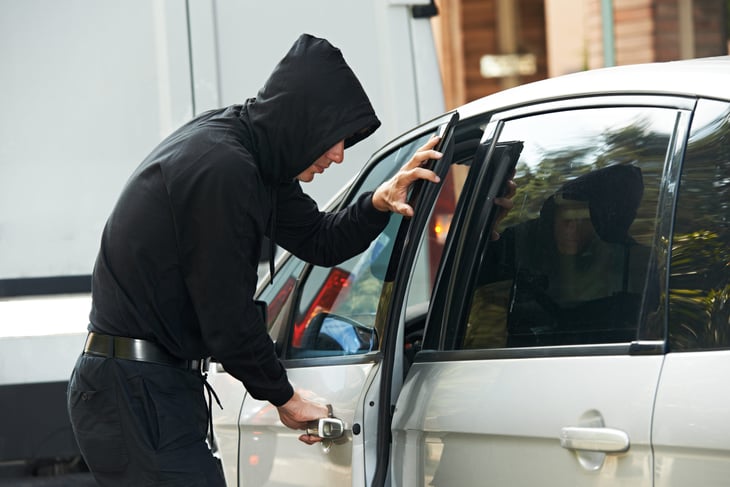
Despite sharp decreases in overall crime this year, car thefts rose dramatically in certain cities. Nearly 750,000 vehicles (or 228 per 100,000 residents) are stolen in the U.S. each year, representing a loss of about $6 billion annually.
While car theft rates have long trended downward alongside overall crime rates, there appears to be a divergence amid the pandemic. This could be due to high unemployment rates combined with drivers not checking in on their parked vehicles as frequently.
Car thefts vary significantly on a geographic level. To determine the car theft capitals of the U.S., researchers at CoPilot analyzed the last three years of Uniform Crime Report data from the FBI.
Cities were ranked according to their average annual motor vehicle theft rate per 100,000 people based on data from 2017 to 2019.
Researchers also calculated the average annual number of motor vehicle thefts, the overall property theft rate, and the violent crime rate for the same years. To improve relevance, only the 150 largest cities in the U.S. were included in the analysis.
Following are the cities with the most vehicle thefts per capita.
25. Wichita, Kansas

- Motor vehicle theft rate: 646 per 100,000 people
- Average annual motor vehicle thefts: 2,519
- Overall property theft rate: 5,505 per 100,000 people
- Violent crime rate: 1,117 per 100,000 people
24. Dallas

- Motor vehicle theft rate: 680 per 100,000 people
- Average annual motor vehicle thefts: 9,277
- Overall property theft rate: 3,232 per 100,000 people
- Violent crime rate: 796 per 100,000 people
23. Omaha, Nebraska

- Motor vehicle theft rate: 693 per 100,000 people
- Average annual motor vehicle thefts: 3,259
- Overall property theft rate: 3,606 per 100,000 people
- Violent crime rate: 597 per 100,000 people
22. San Jose, California
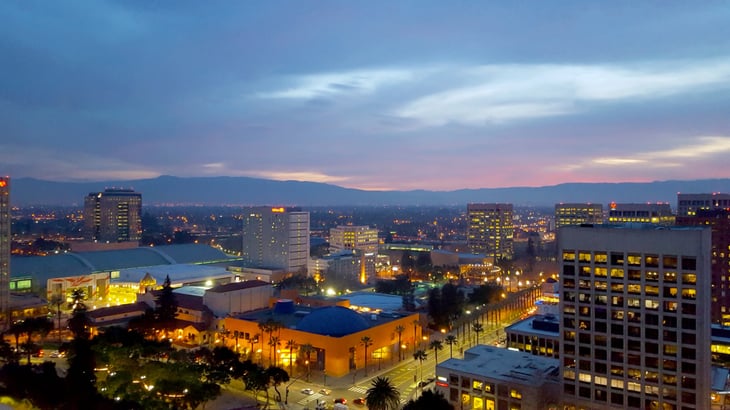
- Motor vehicle theft rate: 702 per 100,000 people
- Average annual motor vehicle thefts: 7,299
- Overall property theft rate: 2,444 per 100,000 people
- Violent crime rate: 423 per 100,000 people
21. Newark, New Jersey

- Motor vehicle theft rate: 705 per 100,000 people
- Average annual motor vehicle thefts: 1,983
- Overall property theft rate: 2,024 per 100,000 people
- Violent crime rate: 753 per 100,000 people
20. Spokane, Washington

- Motor vehicle theft rate: 710 per 100,000 people
- Average annual motor vehicle thefts: 1,565
- Overall property theft rate: 6,681 per 100,000 people
- Violent crime rate: 699 per 100,000 people

19. New Orleans

- Motor vehicle theft rate: 716 per 100,000 people
- Average annual motor vehicle thefts: 2,825
- Overall property theft rate: 4,716 per 100,000 people
- Violent crime rate: 1,148 per 100,000 people
18. Bakersfield, California
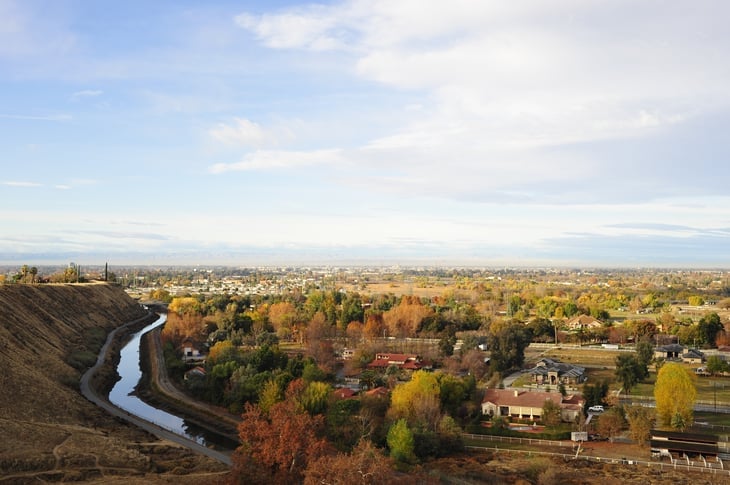
- Motor vehicle theft rate: 727 per 100,000 people
- Average annual motor vehicle thefts: 2,821
- Overall property theft rate: 4,095 per 100,000 people
- Violent crime rate: 471 per 100,000 people
17. St. Paul, Minnesota

- Motor vehicle theft rate: 730 per 100,000 people
- Average annual motor vehicle thefts: 2,266
- Overall property theft rate: 3,462 per 100,000 people
- Violent crime rate: 611 per 100,000 people
16. Denver

- Motor vehicle theft rate: 738 per 100,000 people
- Average annual motor vehicle thefts: 5,376
- Overall property theft rate: 3,643 per 100,000 people
- Violent crime rate: 709 per 100,000 people
15. Chattanooga, Tennessee

- Motor vehicle theft rate: 748 per 100,000 people
- Average annual motor vehicle thefts: 1,360
- Overall property theft rate: 5,817 per 100,000 people
- Violent crime rate: 1,053 per 100,000 people
14. Baltimore, Maryland

- Motor vehicle theft rate: 753 per 100,000 people
- Average annual motor vehicle thefts: 4,495
- Overall property theft rate: 4,643 per 100,000 people
- Violent crime rate: 1,933 per 100,000 people
13. Salt Lake City

- Motor vehicle theft rate: 764 per 100,000 people
- Average annual motor vehicle thefts: 1,546
- Overall property theft rate: 6,531 per 100,000 people
- Violent crime rate: 763 per 100,000 people
12. Milwaukee

- Motor vehicle theft rate: 764 per 100,000 people
- Average annual motor vehicle thefts: 4,514
- Overall property theft rate: 3,123 per 100,000 people
- Violent crime rate: 1,455 per 100,000 people
11. Cleveland

- Motor vehicle theft rate: 798 per 100,000 people
- Average annual motor vehicle thefts: 3,048
- Overall property theft rate: 4,624 per 100,000 people
- Violent crime rate: 1,516 per 100,000 people
10. Tulsa, Oklahoma

- Motor vehicle theft rate: 809 per 100,000 people
- Average annual motor vehicle thefts: 3,251
- Overall property theft rate: 5,420 per 100,000 people
- Violent crime rate: 1,035 per 100,000 people

9. Kansas City, Missouri

- Motor vehicle theft rate: 836 per 100,000 people
- Average annual motor vehicle thefts: 4,147
- Overall property theft rate: 4,194 per 100,000 people
- Violent crime rate: 1,566 per 100,000 people
8. Tacoma, Washington

- Motor vehicle theft rate: 852 per 100,000 people
- Average annual motor vehicle thefts: 1,863
- Overall property theft rate: 5,287 per 100,000 people
- Violent crime rate: 831 per 100,000 people
7. Anchorage, Alaska

- Motor vehicle theft rate: 864 per 100,000 people
- Average annual motor vehicle thefts: 2,486
- Overall property theft rate: 4,946 per 100,000 people
- Violent crime rate: 1,271 per 100,000 people
6. St. Louis

- Motor vehicle theft rate: 938 per 100,000 people
- Average annual motor vehicle thefts: 2,820
- Overall property theft rate: 6,153 per 100,000 people
- Violent crime rate: 1,972 per 100,000 people
5. San Bernardino, California
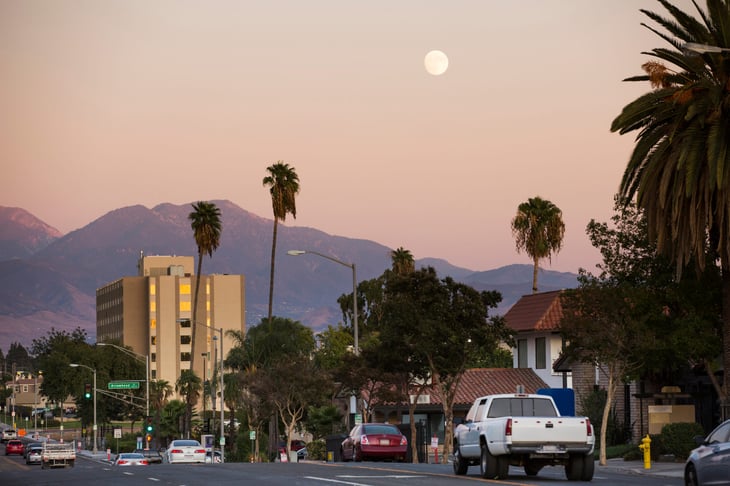
- Motor vehicle theft rate: 1,007 per 100,000 people
- Average annual motor vehicle thefts: 2,183
- Overall property theft rate: 4,076 per 100,000 people
- Violent crime rate: 1,318 per 100,000 people
4. Portland, Oregon

- Motor vehicle theft rate: 1,040 per 100,000 people
- Average annual motor vehicle thefts: 6,886
- Overall property theft rate: 5,397 per 100,000 people
- Violent crime rate: 522 per 100,000 people
3. Detroit

- Motor vehicle theft rate: 1,080 per 100,000 people
- Average annual motor vehicle thefts: 7,165
- Overall property theft rate: 4,416 per 100,000 people
- Violent crime rate: 2,025 per 100,000 people
2. Albuquerque, New Mexico
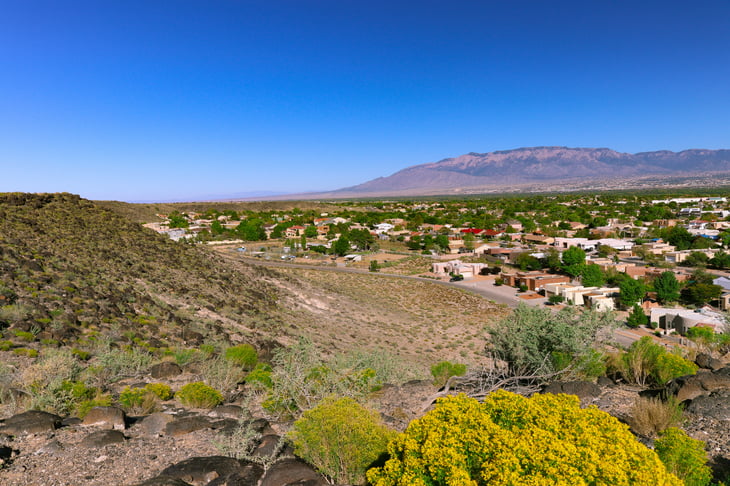
- Motor vehicle theft rate: 1,170 per 100,000 people
- Average annual motor vehicle thefts: 6,575
- Overall property theft rate: 4,507 per 100,000 people
- Violent crime rate: 1,360 per 100,000 people
1. Oakland, California
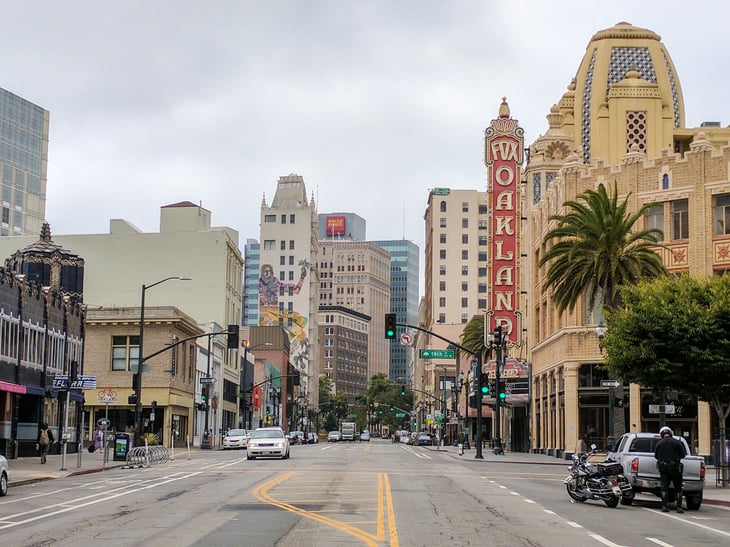
- Motor vehicle theft rate: 1,199 per 100,000 people
- Average annual motor vehicle thefts: 5,202
- Overall property theft rate: 5,874 per 100,000 people
- Violent crime rate: 1,269 per 100,000 people
Add a Comment
Our Policy: We welcome relevant and respectful comments in order to foster healthy and informative discussions. All other comments may be removed. Comments with links are automatically held for moderation.