


U.S. home sale prices in January were up 6.7% from a year earlier, the largest increase in a year, according to an analysis of the 50 most populous metropolitan areas by real estate brokerage firm Redfin.
Prices rose 0.5% from December to January, marking a third straight month of a gain of that size.
In a summary of the findings, Sheharyar Bokhari, Redfin senior economist, said price growth continued because many of the home purchases closing in January were actually negotiated near the end of 2023. At that time, mortgage rates saw their biggest drop since 2008:
“The decline in rates gave buyers more purchasing power, and for some, a sense of urgency to lock in a mortgage. Prices also climbed because there’s still a shortage of homes for sale, which is fueling competition in some areas.”
Here are the top major metros where home prices won’t stop climbing. In all of these places, year-over-year home price increases were in the double digits.
1. Cincinnati

Change in the Redfin Home Price Index for this metropolitan area as of January 2024:
- Year over year: 15.8% increase
- Month over month: 1.4% increase
Three U.S. presidents — Ulysses S. Grant, Benjamin Harrison and William Howard Taft — were born in the Cincinnati area. A fourth — William Henry Harrison — lived in the Ohio city after his presidency was over.
2. Newark, New Jersey

Change in the Redfin Home Price Index for this metropolitan area as of January 2024:
- Year over year: 15.8% increase
- Month over month: 1.3% increase
Located just 8 miles from Manhattan, Newark has a rich history. The New Jersey city is home to North America’s fifth-largest cathedral, and you will find more than 4,000 cherry trees in Branch Brook Park.
3. San Jose, California

Change in the Redfin Home Price Index for this metropolitan area as of January 2024:
- Year over year: 14.7% increase
- Month over month: 0.2% increase
At one time, San Jose was the capital of California. The state’s leaders gathered in a two-story hotel, but it burned down in 1853. The following year, the legislature moved to the city of Sacramento, which officially became the capital in 1879.
4. Cleveland

Change in the Redfin Home Price Index for this metropolitan area as of January 2024:
- Year over year: 14% increase
- Month over month: 1.7% increase
When the lights went on in the Public Square in Cleveland, Ohio, in 1879, it became the first city lit by electricity.
5. New Brunswick, New Jersey

Change in the Redfin Home Price Index for this metropolitan area as of January 2024:
- Year over year: 13.1% increase
- Month over month: 1.3% increase
The first-ever college football game took place in New Brunswick, New Jersey, in 1869. Rutgers University beat College of New Jersey — now known as Princeton University — 6-4 before a crowd of 100 people.

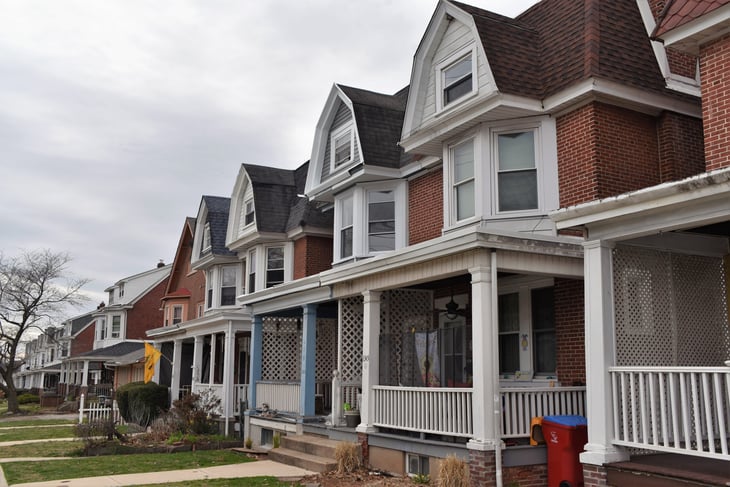
6. Philadelphia

Change in the Redfin Home Price Index for this metropolitan area as of January 2024:
- Year over year: 12.4% increase
- Month over month: 1.9% decrease
Mural Arts Philadelphia is the largest public art program in America. Each year, it helps to foster dozens of public art projects in communities across Pennsylvania’s largest city.
7. Chicago
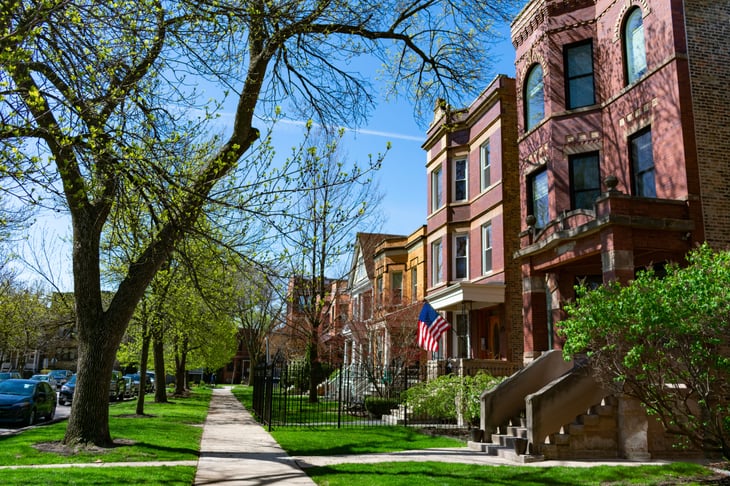
Change in the Redfin Home Price Index for this metropolitan area as of January 2024:
- Year over year: 11.8% increase
- Month over month: 0.9% increase
Each year, the city of Chicago, Illinois, celebrates St. Patrick’s Day by dyeing the Chicago River green. Erin go bragh!
8. New York City

Change in the Redfin Home Price Index for this metropolitan area as of January 2024:
- Year over year: 11.5% increase
- Month over month: 1.6% increase
New York’s famed Central Park, located in the New York City borough of Manhattan, has appeared in more than 240 feature films. That makes it the most-filmed public park in the world.
9. Providence, Rhode Island

Change in the Redfin Home Price Index for this metropolitan area as of January 2024:
- Year over year: 11.4% increase
- Month over month: 0.3% decrease
The biggest bug in the world is located on the roof of New England Pest Control in Providence, Rhode Island. The huge blue termite is 58 feet long — or more than 900 times the size of a real termite.
10. Montgomery County, Pennsylvania
Change in the Redfin Home Price Index for this metropolitan area as of January 2024:
- Year over year: 10.8% increase
- Month over month: 3.7% increase
The top 10 metropolitan areas in Redfin’s home price analysis include two in Ohio, two in New Jersey and now two in Pennsylvania.
Montgomery County is informally referred to as Montco. Its county seat is Norristown.
Other major metros with steep home price increases
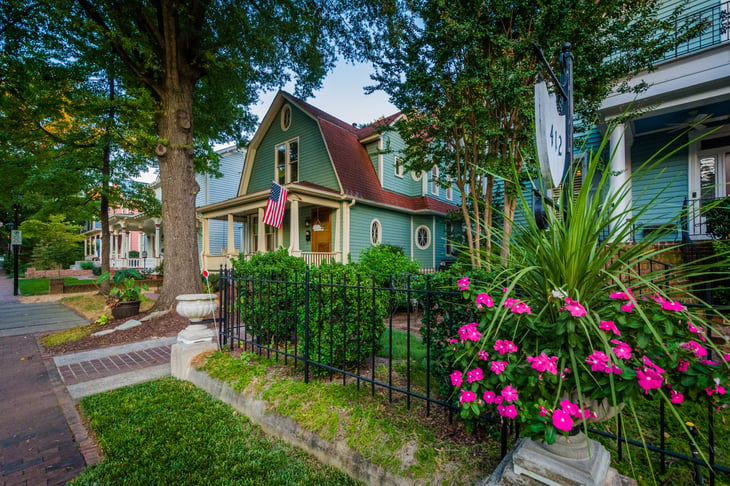
Here are the other major markets where prices as of January reflect increases of 10% or more over the past year:
- Charlotte, North Carolina: 10.8% increase year over year, 0.7% decrease month over month
- Anaheim, California: 10.6% increase, 0.4% increase
- Boston, Massachusetts: 10.6% increase, 0.1% increase
Add a Comment
Our Policy: We welcome relevant and respectful comments in order to foster healthy and informative discussions. All other comments may be removed. Comments with links are automatically held for moderation.