



Editor's Note: This story originally appeared on U.S. Money Reserve.
While the hot real estate market of the last few years has cooled, many younger would-be homebuyers continue to struggle to purchase homes in the face of limited housing supply.
One of the most significant trends affecting housing supply in the U.S. is the aging of the baby boomer generation. Baby boomers — the generation born between 1946 and 1964 — currently own more than 30 million U.S. homes.
Unlike members of previous generations who may have sold homes later in life to downsize, move in with family, or move to an assisted living facility, baby boomers have shown a greater propensity to age in place. And as older Americans hold onto their homes, less existing supply is available for new buyers entering the market.
To determine the locations where retirement-age Americans have been in their homes the longest, researchers at U.S. Money Reserve calculated the percentage of 65-and-over households that moved in at least 30 years ago, with only owner-occupied households being considered.
The data used in this analysis is from the U.S. Census Bureau. Find details on the methodology at the end.
Here are the U.S. metropolitan areas where seniors have been in their homes the longest.
15. Baltimore-Columbia-Towson, MD
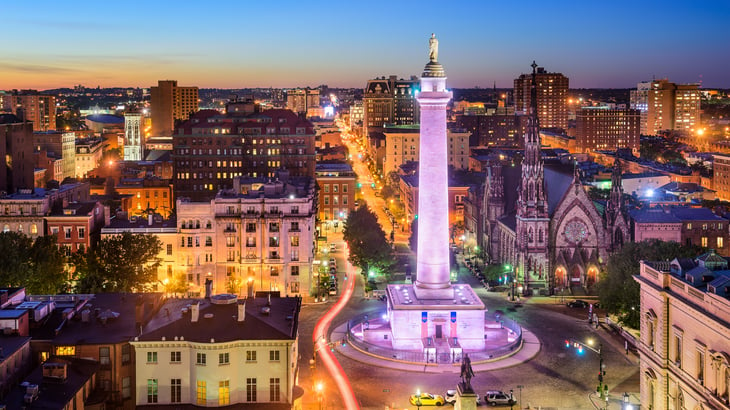
- Share of 65+ households that moved in 30+ years ago: 6%
- Share of 65+ households that moved in 20+ years ago: 4%
- Share of 65+ households that moved in 10+ years ago: 5%
- Share of 65+ households that move in <10 years ago: 5%
- 65+ share of owner-occupied households: 0%
- 65+ share of total population: 3%
14. Rochester, NY
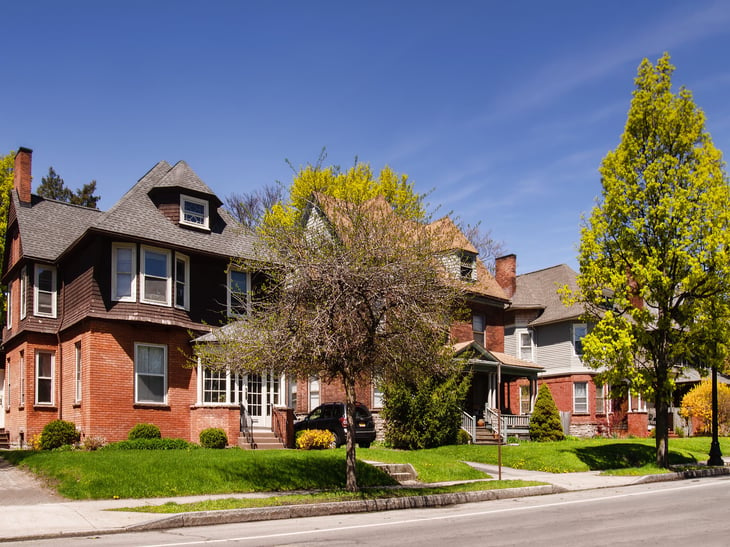
- Share of 65+ households that moved in 30+ years ago: 9%
- Share of 65+ households that moved in 20+ years ago: 7%
- Share of 65+ households that moved in 10+ years ago: 4%
- Share of 65+ households that move in <10 years ago: 6%
- 65+ share of owner-occupied households: 6%
- 65+ share of total population: 0%
13. Cleveland-Elyria, OH

- Share of 65+ households that moved in 30+ years ago: 6%
- Share of 65+ households that moved in 20+ years ago: 5%
- Share of 65+ households that moved in 10+ years ago: 3%
- Share of 65+ households that move in <10 years ago: 7%
- 65+ share of owner-occupied households: 4%
- 65+ share of total population: 4%

12. Boston-Cambridge-Newton, MA-NH
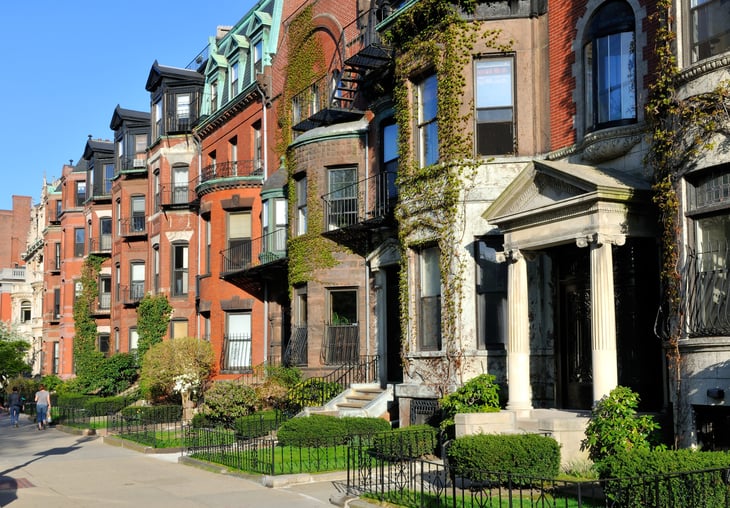
- Share of 65+ households that moved in 30+ years ago: 0%
- Share of 65+ households that moved in 20+ years ago: 5%
- Share of 65+ households that moved in 10+ years ago: 7%
- Share of 65+ households that move in <10 years ago: 3%
- 65+ share of owner-occupied households: 8%
- 65+ share of total population: 5%
11. Detroit-Warren-Dearborn, MI
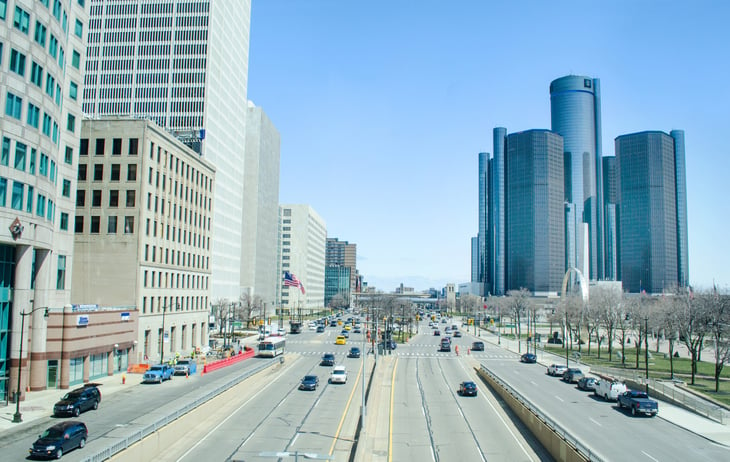
- Share of 65+ households that moved in 30+ years ago: 3%
- Share of 65+ households that moved in 20+ years ago: 0%
- Share of 65+ households that moved in 10+ years ago: 0%
- Share of 65+ households that move in <10 years ago: 0%
- 65+ share of owner-occupied households: 1%
- 65+ share of total population: 3%
10. New York-Newark-Jersey City, NY-NJ-PA
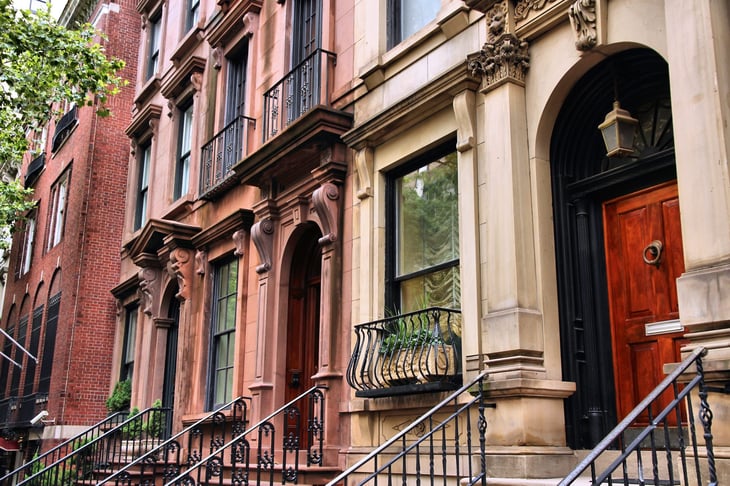
- Share of 65+ households that moved in 30+ years ago: 5%
- Share of 65+ households that moved in 20+ years ago: 1%
- Share of 65+ households that moved in 10+ years ago: 4%
- Share of 65+ households that move in <10 years ago: 6%
- 65+ share of owner-occupied households: 9%
- 65+ share of total population: 7%
9. Los Angeles-Long Beach-Anaheim, CA
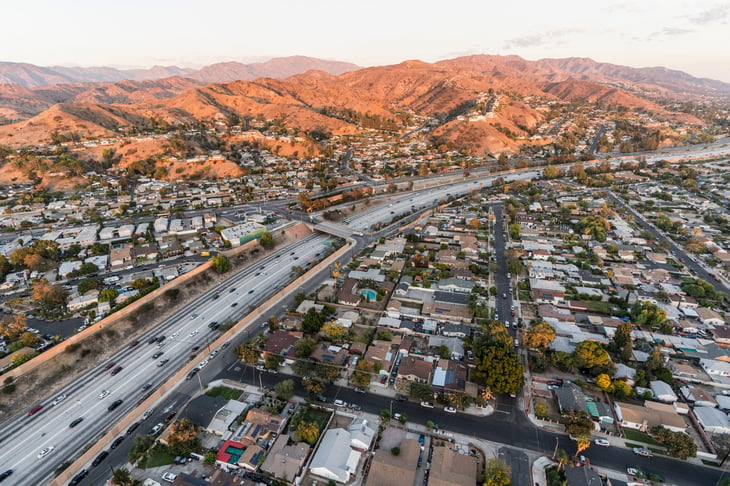
- Share of 65+ households that moved in 30+ years ago: 1%
- Share of 65+ households that moved in 20+ years ago: 7%
- Share of 65+ households that moved in 10+ years ago: 9%
- Share of 65+ households that move in <10 years ago: 1%
- 65+ share of owner-occupied households: 9%
- 65+ share of total population: 9%
8. San Francisco-Oakland-Berkeley, CA
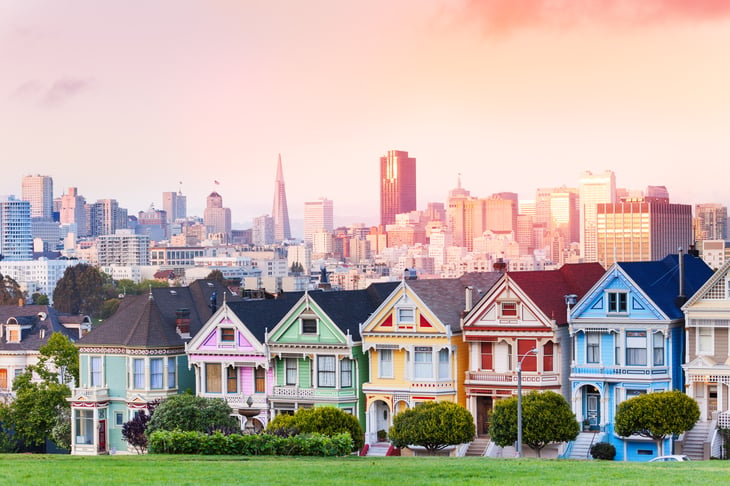
- Share of 65+ households that moved in 30+ years ago: 3%
- Share of 65+ households that moved in 20+ years ago: 4%
- Share of 65+ households that moved in 10+ years ago: 2%
- Share of 65+ households that move in <10 years ago: 8%
- 65+ share of owner-occupied households: 9%
- 65+ share of total population: 7%
7. San Jose-Sunnyvale-Santa Clara, CA
- Share of 65+ households that moved in 30+ years ago: 9%
- Share of 65+ households that moved in 20+ years ago: 2%
- Share of 65+ households that moved in 10+ years ago: 9%
- Share of 65+ households that move in <10 years ago: 1%
- 65+ share of owner-occupied households: 9%
- 65+ share of total population: 4%
6. Providence-Warwick, RI-MA
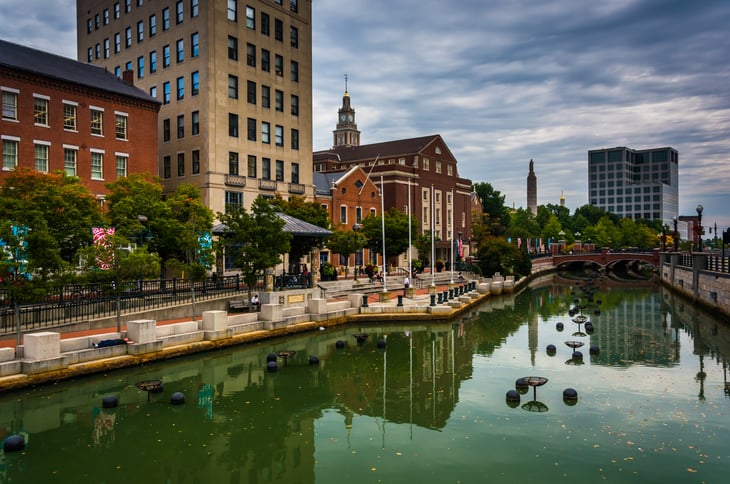
- Share of 65+ households that moved in 30+ years ago: 1%
- Share of 65+ households that moved in 20+ years ago: 5%
- Share of 65+ households that moved in 10+ years ago: 5%
- Share of 65+ households that move in <10 years ago: 5%
- 65+ share of owner-occupied households: 5%
- 65+ share of total population: 18.0%
5. Philadelphia-Camden-Wilmington, PA-NJ-DE-MD
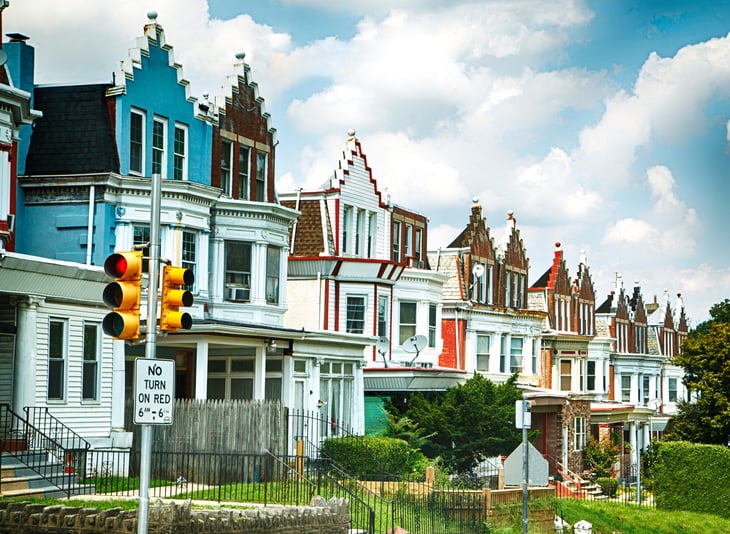
- Share of 65+ households that moved in 30+ years ago: 9%
- Share of 65+ households that moved in 20+ years ago: 3%
- Share of 65+ households that moved in 10+ years ago: 6%
- Share of 65+ households that move in <10 years ago: 4%
- 65+ share of owner-occupied households: 7%
- 65+ share of total population: 8%
4. Hartford-East Hartford-Middletown, CT

- Share of 65+ households that moved in 30+ years ago: 8%
- Share of 65+ households that moved in 20+ years ago: 9%
- Share of 65+ households that moved in 10+ years ago: 8%
- Share of 65+ households that move in <10 years ago: 2%
- 65+ share of owner-occupied households: 3%
- 65+ share of total population: 2%
3. Buffalo-Cheektowaga, NY
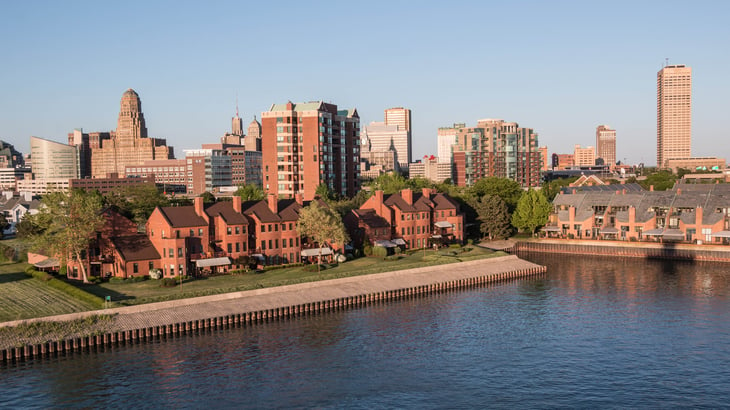
- Share of 65+ households that moved in 30+ years ago: 2%
- Share of 65+ households that moved in 20+ years ago: 0%
- Share of 65+ households that moved in 10+ years ago: 9%
- Share of 65+ households that move in <10 years ago: 1%
- 65+ share of owner-occupied households: 4%
- 65+ share of total population: 1%
2. Urban Honolulu, HI

- Share of 65+ households that moved in 30+ years ago: 4%
- Share of 65+ households that moved in 20+ years ago: 3%
- Share of 65+ households that moved in 10+ years ago: 0%
- Share of 65+ households that move in <10 years ago: 0%
- 65+ share of owner-occupied households: 7%
- 65+ share of total population: 8%
1. Pittsburgh, PA
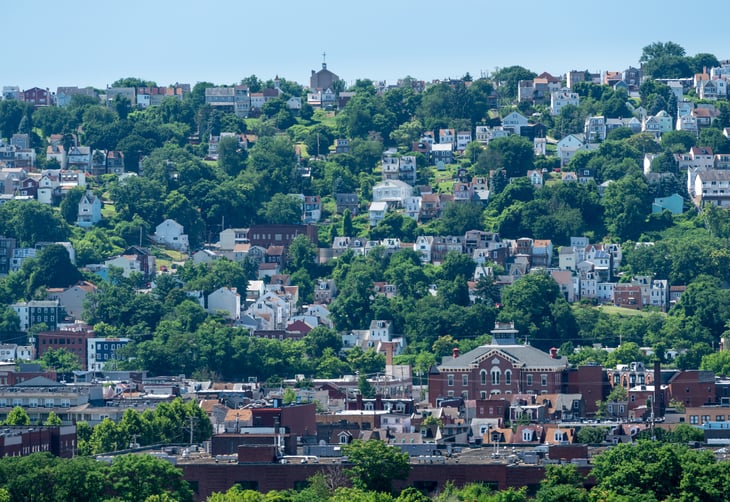
- Share of 65+ households that moved in 30+ years ago: 5%
- Share of 65+ households that moved in 20+ years ago: 0%
- Share of 65+ households that moved in 10+ years ago: 1%
- Share of 65+ households that move in <10 years ago: 9%
- 65+ share of owner-occupied households: 7%
- 65+ share of total population: 8%
Methodology

The data used in this analysis is from the U.S. Census Bureau’s “2021 American Community Survey Public Use Microdata Sample.”
To determine the locations where retirement-age Americans have been in their homes the longest, researchers calculated the percentage of 65-and-over households that moved in at least 30 years ago. In the event of a tie, the location with the greater share of 65-and-over households that moved in at least 20 years ago was ranked higher.
Only owner-occupied households were considered.
For the purpose of this analysis, 65-and-over households were defined as those headed by an individual who was 65 or over at the time of the survey.
Researchers also calculated the percentage of all owner-occupied households that are headed by someone 65 or over, as well as the 65-and-over percentage of the total population. To improve relevance, only metro areas with at least 100,000 total people were included.

Add a Comment