


Editor's Note: This story originally appeared on Construction Coverage.
Construction workers remain a crucial component of the American workforce, driving economic growth through their work in essential sectors.
Their efforts serve as a foundation for initiatives such as expanding the supply of residential housing and investing in competitive American manufacturing. By building the houses, buildings, and infrastructure necessary to achieve these goals, construction workers contribute significantly to the country’s economic development.
Employment in construction is unevenly distributed across the country.
To determine the locations with the most construction industry jobs, researchers at Construction Coverage calculated the percentage of total employment in the construction sector in the fourth quarter of 2022, the latest data available.
The data used in this analysis is from the U.S. Bureau of Labor Statistics. See the details of the methodology at the end.
Here are the U.S. metropolitan areas with the most construction industry jobs.
15. Seattle-Tacoma-Bellevue, WA

- Percentage of employment in construction: 6.18%
- Construction employment concentration (compared with average): +0.9 pp
- Total number of construction employees: 128,907
- Year-over-year change in construction employment: +2.2%
14. Austin-Round Rock-Georgetown, TX

- Percentage of employment in construction: 6.25%
- Construction employment concentration (compared with average): +1.0 pp
- Total number of construction employees: 76,040
- Year-over-year change in construction employment: +4.4%
13. Tampa-St. Petersburg-Clearwater, FL

- Percentage of employment in construction: 6.33%
- Construction employment concentration (compared with average): +1.1 pp
- Total number of construction employees: 89,310
- Year-over-year change in construction employment: +3.6%

12. Richmond, VA

- Percentage of employment in construction: 6.36%
- Construction employment concentration (compared with average): +1.1 pp
- Total number of construction employees: 41,011
- Year-over-year change in construction employment: +4.5%
11. Orlando-Kissimmee-Sanford, FL

- Percentage of employment in construction: 6.37%
- Construction employment concentration (compared with average): +1.1 pp
- Total number of construction employees: 86,777
- Year-over-year change in construction employment: +5.3%
10. Raleigh-Cary, NC

- Percentage of employment in construction: 6.65%
- Construction employment concentration (compared with average): +1.4 pp
- Total number of construction employees: 46,243
- Year-over-year change in construction employment: +5.3%
9. Portland-Vancouver-Hillsboro, OR-WA

- Percentage of employment in construction: 6.65%
- Construction employment concentration (compared with average): +1.4 pp
- Total number of construction employees: 80,782
- Year-over-year change in construction employment: +5.2%
8. Denver-Aurora-Lakewood, CO

- Percentage of employment in construction: 6.69%
- Construction employment concentration (compared with average): +1.5 pp
- Total number of construction employees: 106,391
- Year-over-year change in construction employment: +4.7%
7. Jacksonville, FL

- Percentage of employment in construction: 6.70%
- Construction employment concentration (compared with average): +1.5 pp
- Total number of construction employees: 49,642
- Year-over-year change in construction employment: +4.9%
6. Salt Lake City, UT

- Percentage of employment in construction: 6.77%
- Construction employment concentration (compared with average): +1.5 pp
- Total number of construction employees: 54,360
- Year-over-year change in construction employment: +4.2%
5. Riverside-San Bernardino-Ontario, CA

- Percentage of employment in construction: 6.78%
- Construction employment concentration (compared with average): +1.5 pp
- Total number of construction employees: 112,783
- Year-over-year change in construction employment: +1.9%
4. Phoenix-Mesa-Chandler, AZ

- Percentage of employment in construction: 6.91%
- Construction employment concentration (compared with average): +1.7 pp
- Total number of construction employees: 158,065
- Year-over-year change in construction employment: +10.1%
3. Sacramento-Roseville-Folsom, CA

- Percentage of employment in construction: 7.20%
- Construction employment concentration (compared with average): +2.0 pp
- Total number of construction employees: 75,937
- Year-over-year change in construction employment: 0%
2. Houston-The Woodlands-Sugar Land, TX

- Percentage of employment in construction: 7.22%
- Construction employment concentration (compared with average): +2.0 pp
- Total number of construction employees: 228,728
- Year-over-year change in construction employment: +5.8%
1. Las Vegas-Henderson-Paradise, NV
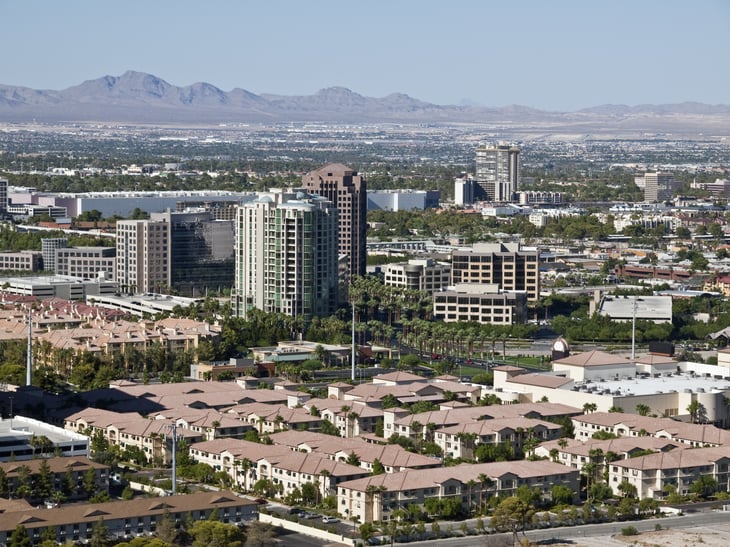
- Percentage of employment in construction: 7.23%
- Construction employment concentration (compared with average): +2.0 pp
- Total number of construction employees: 78,201
- Year-over-year change in construction employment: +11.7%
Methodology

The data used in this analysis is from the U.S. Bureau of Labor Statistics’ “Quarterly Census of Employment and Wages.”
To determine the locations with the most construction industry jobs, researchers at Construction Coverage calculated the percentage of total employment in the construction sector in Q4 2022, the latest data available. In the event of a tie, the location with the greater total number of construction industry employees was ranked higher.
To improve relevance, only metropolitan areas with at least 100,000 residents were included.
Add a Comment
Our Policy: We welcome relevant and respectful comments in order to foster healthy and informative discussions. All other comments may be removed. Comments with links are automatically held for moderation.