
A low credit score can keep us from getting loans, credit cards, and maybe even apartments and jobs. That little three-digit number can make or break us financially.
Recently a website called LendEDU took a state-by-state look at credit scores. The idea, according to writer Andrew Rombach, was “to see which states’ residents were doing well financially and (note the) difference between the top-performing states compared to the rest of the country.”
In this study, LendEDU determined the national average credit score to be 682. That number and the state-by-state average scores were calculated based not on Fair Isaac Corporation (FICO) data, but with material from the VantageScore system. This scoring model, jointly created and owned by the three major credit reporting bureaus, requires only one month of credit history and uses fewer updates than FICO does.
VantageScore ignores bills that were once sent to collections but have since been paid off. Unlike FICO, the system takes into consideration rental- and utility-payment histories — a boon to those who have never used credit. Thus this particular credit snapshot likely provides a better indicator of financial health
Admit it: You’re dying to know where your state stands. This ranking starts with the top-scoring state, and proceeds to the worst.
1. Minnesota

VantageScore: 722
Population: 5,519,952
Median household income: $61,492
Residents aged 25+ with at least 4-year college degree: 33.7 percent
The Land of 10,000 Lakes floats well above the other states and the District of Columbia. Its VantageScore of 722 is 7.27 percent higher than the national average.
2. North Dakota

VantageScore: 713
Population: 757,952
Median household income: $57,181
Residents aged 25+ with at least 4-year college degree: 27.7 percent
North Dakota is the only state in the union with a state-owned bank. It’s called — you guessed it — the Bank of North Dakota.
Fun fact: It also has a state-owned flour mill.
3. Vermont

VantageScore: 713
Population: 624,594
Median household income: $55,176
Residents aged 25+ with at least 4-year college degree: 36 percent
4. New Hampshire

VantageScore: 712
Population: 1,334,795
Median household income: $66,779
Residents aged 25+ with at least 4-year college degree: 34.9 percent
New Hampshire residents have the highest amount of student loans in the country: an average of $36,101 per borrower.
5. South Dakota

VantageScore: 711
Population: 865,454
Median household income: $50,957
Residents aged 25+ with at least 4-year college degree: 27 percent
South Dakota is tied with Oregon as the state with the lowest rate of 30-day auto loan delinquencies: Just 1 percent of car notes are overdue in the Mount Rushmore State.
6. Wisconsin

VantageScore: 710
Population: 7,778,708
Median household income: $53,357
Residents aged 25+ with at least 4-year college degree: 27.8 percent
7. Iowa

VantageScore: 708
Population: 3,134,693
Median household income: $53,183
Residents aged 25+ with at least 4-year college degree: 26.7 percent
8. Massachusetts

VantageScore: 706
Population: 6,811,779
Median household income: $68,563
Residents aged 25+ with at least 4-year college degree: 40.5 percent
The Bay State has the second-highest number of college graduates in the country. Only Washington, D.C. has more.
9. Washington

VantageScore: 704
Population: 7,288,000
Median household income: $61,062
Residents aged 25+ with at least 4-year college degree: 32.9 percent
10. Hawaii

VantageScore: 702
Population: 1,428,557
Median household income: $69,515
Residents aged 25+ with at least 4-year college degree: 30.8 percent
As of October 2017, Hawaii had the country’s lowest unemployment rate: 2.2 percent.
11. Montana

VantageScore: 702
Population: 1,042,520
Median household income: $47,169
Residents aged 25+ with at least 4-year college degree: 29.5 percent
12. Colorado

VantageScore: 701
Population: 5,540,545
Median household income: $60,629
Residents aged 25+ with at least 4-year college degree: 38.1 percent
13. Nebraska

VantageScore: 700
Population: 1,907,116
Median household income: $52,997
Residents aged 25+ with at least 4-year college degree: 29.3 percent
14. Oregon

VantageScore: 700
Population: 4,093,465
Median household income: $51,243
Residents aged 25+ with at least 4-year college degree: 30.8 percent
15. Connecticut

VantageScore: 698
Population: 3,576,452
Median household income: $70,331
Residents with at least 4-year college degree: 37.6 percent
Connecticut has the third-highest amount of student loan debt in the nation, at $34,773 per person.
16. Utah
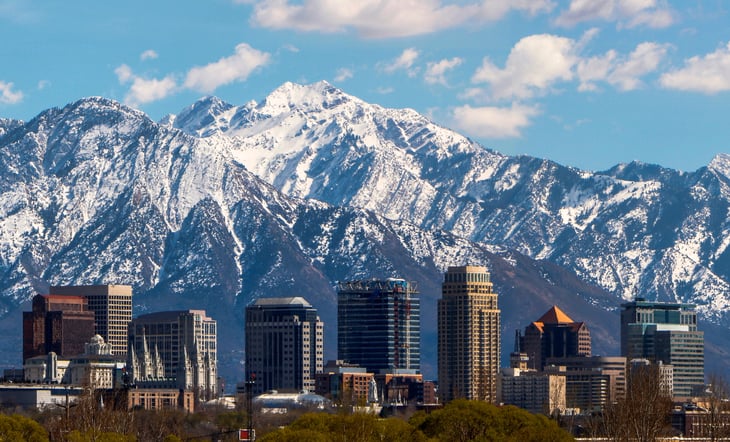
VantageScore: 698
Population: 3,051,217
Median household income: $60,727
Residents aged 25+ with at least 4-year college degree: 31.1 percent
The Beehive State has the nation’s lowest average student loan debt, at $18,873.
17. Maine
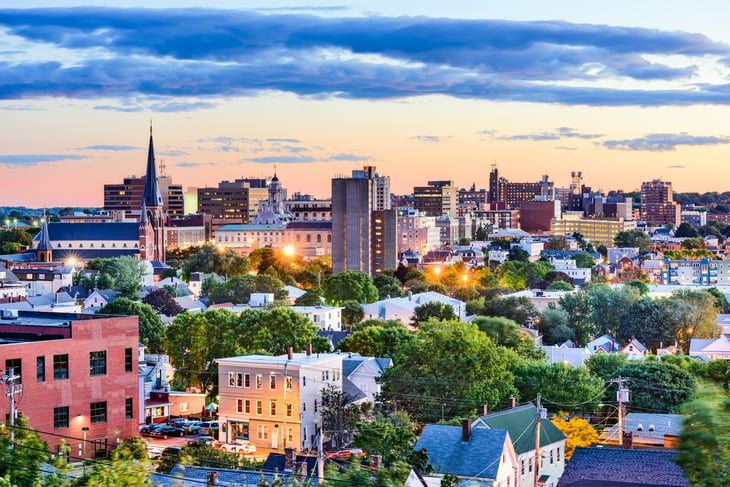
VantageScore: 697
Population: 1,331,479
Median household income: $49,331
Residents aged 25+ with at least 4-year college degree: 29 percent
18. Idaho

VantageScore: 695
Population: 1,683,140
Median household income: $47,583
Residents aged 25+ with at least 4-year college degree: 25.9 percent
19. New York

VantageScore: 694
Population: 19,745,289
Median household income: $59,269
Residents aged 25+ with at least 4-year college degree: 34.2 percent
New York City is a relatively small part of the Empire State, but it’s the part with which many people identify. If you want to live there, better earn a bundle: Rents have increased twice as fast as salaries, according to Business Insider.
20. Pennsylvania

VantageScore: 694
Population: 12,784,227
Median household income: $53,599
Residents aged 25+ with at least 4-year college degree: 28.6 percent
Pennsylvania has the second-highest average student loan debt in the country, at $34,798 per person.
21. Wyoming

VantageScore: 694
Population: 585,501
Median household income: $58,840
Residents aged 25+ with at least 4-year college degree: 25.7 percent
22. New Jersey

VantageScore: 692
Population: 8,944,469
Median household income: $72,093
Residents aged 25+ with at least 4-year college degree: 36.8 percent
Garden State residents owe an average of $8,406.60 in credit card debt.
23. Rhode Island
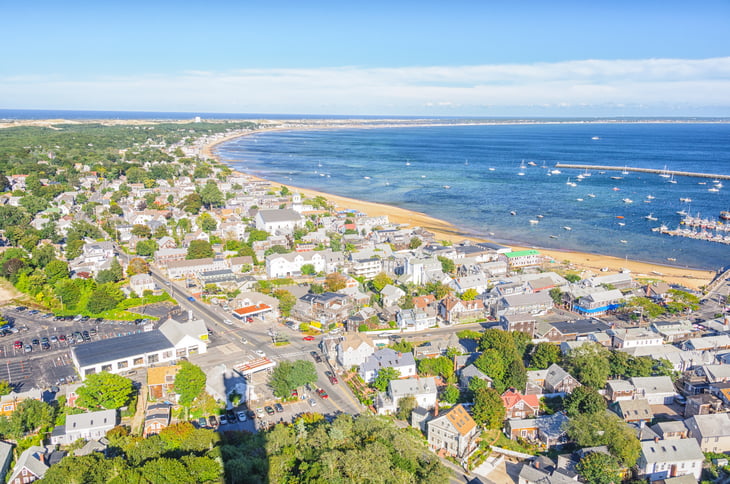
VantageScore: 691
Population: 1,056,426
Median household income: $56,852
Residents aged 25+ with at least 4-year college degree: 31.9 percent
While the job market is improving in the Ocean State, employment opportunities tend to be low-wage. According to the U.S. Department of Agriculture, Rhode Island is one of just two states that since 2011 has seen a significant increase in the prevalence of hunger. (The other one is Louisiana.)
24. Virginia

VantageScore: 690
Population: 8,411,808
Median household income: $65,015
Residents aged 25+ with at least 4-year college degree: 36.3 percent
Virginia residents carry an average balance of $7,848.17 on their credit cards.
25. Illinois

VantageScore: 689
Population: 12,801,539
Median household income: $57,574
Residents aged 25+ with at least 4-year college degree: 32.3 percent
Forbes rated this state No. 46 on its “worst state for taxes” list. A couple of recent examples that have hit residents hard: a 32 percent income tax hike and a penny-per-ounce sweetened beverage tax (which was later repealed).
26. California

VantageScore: 688
Population: 39,250,017
Median household income: $61,818
Residents aged 25+ with at least 4-year college degree: 31.4 percent
27. Kansas

VantageScore: 684
Population: 2,907,289
Median household income: $52,205
Residents aged 25+ with at least 4-year college degree: 31 percent
28. Michigan

VantageScore: 684
Population: 9,928,300
Median household income: $49,576
Residents aged 25+ with at least 4-year college degree: 26.9 percent
Fifteen percent of Michigan residents live in poverty.
29. Ohio

VantageScore: 684
Population: 11,614,373
Median household income: $49,429
Residents aged 25+ with at least 4-year college degree: 26.1 percent
After a political battle, Ohio raised its minimum wage to $8.30 an hour at the start of 2018, a 15-cent increase.
The state was one of 18 that increased minimum wage at the start of the year. The federal minimum wage is $7.25 per hour.
30. Missouri

VantageScore: 681
Population: 6,093,000
Median household income: $48,173
Residents aged 25+ with at least a 4-year degree: 27.1 percent
31. Delaware

VantageScore: 679
Population: 952,065
Median household income: $60,509
Residents aged 25+ with at least 4-year college degree: 30 percent
The second-smallest state has the fourth-highest amount of education debt, with an average balance of $33,849 per borrower.
32. Maryland

VantageScore: 679
Population: 6,016,447
Median household income: $74,551
Residents aged 25+ with at least 4-year college degree: 37.9 percent
33. Indiana

VantageScore: 677
Population: 6,633,053
Median household income: $49,255
Residents aged 25+ with at least 4-year college degree: 24.1 percent
34. Alaska

VantageScore: 675
Population: 741,894
Median household income: $72,515
Residents aged 25+ with at least 4-year college degree: 28 percent
Sure, people who live here get an annual check called the Permanent Fund Dividend. But the cost of living is pretty high, and at least some of that is going on plastic: According to Bankrate.com, as of late 2016, the Last Frontier was also home to the highest average credit-card debt per person: $8,604.19.
And: As of October 2017, Alaska’s unemployment rate was 7.1 percent, compared to the national rate of 4.1 percent. Ouch.
35. Washington, D.C.

VantageScore: 674
Population: 681,170
Median household income: $70,848
Residents aged 25+ with at least 4-year college degree: 54.6 percent
Nearly one in five (18.6 percent) residents in the District of Columbia lives in poverty. As of October 2017, unemployment in the nation’s capital was a painful 6.6 percent.
36. North Carolina

VantageScore: 673
Population: 10,146,788
Median household income: $46,868
Residents aged 25+ with at least 4-year college degree: 28.4 percent
37. Florida

VantageScore: 672
Population: 20,612,439
Median household income: $47,507
Residents aged 25+ with at least 4-year college degree: 27.3 percent
In 2016, Florida had more home foreclosures (45,000) than any other state. It remained among the top 10 states for foreclosures rates in 2017, despite a drop of 45 percent compared to a year earlier.
38. Arizona

VantageScore: 671
Population: 6,931,071
Median household income: $50,255
Residents aged 25+ with at least 4-year college degree: 27.5 percent
More than 16 percent of Arizona residents live in poverty.
39. Kentucky

VantageScore: 669
Population: 4,436,974
Median household income: $43,740
Residents aged 25+ with at least 4-year college degree: 22.3 percent
40. West Virginia

VantageScore: 668
Population: 1,831,102
Median household income: $41,751
Residents aged 25+ with at least 4-year college degree: 19.2 percent
Nearly 10 percent of West Virginians between the ages of 18 and 64 receive Social Security Disability Insurance payments from the federal government. The state ranks highest or second-highest in rates of hypertension, heart attacks, diabetes, and recurring back, knee and leg pain.
41. Tennessee

VantageScore: 667
Population: 6,651,194
Median household income: $45,219
Residents aged 25+ with at least 4-year college degree: 24.9 percent
42. New Mexico

VantageScore: 664
Population: 2,081,015
Median household income: $44,963
Residents aged 25+ with at least 4-year college degree: 26.3 percent
Nearly 20 percent (19.8) of New Mexico residents live in poverty. As of October 2017, the state unemployment rate was 6.1 percent, two percentage points higher than the national rate.
43. Oklahoma

VantageScore: 663
Population: 3,923,561
Median household income: $46,879
Residents aged 25+ with at least 4-year college degree: 24.1 percent
44. Arkansas

VantageScore: 662
Population: 2,988,248
Median household income: $41,371
Residents aged 25+ with at least 4-year college degree: 21.1 percent
According to the U.S. Department of Health and Human Services, the state has the highest teen pregnancy rate: Almost 40 out of every 1,000 girls will give birth between the ages of 15 and 19.
45. South Carolina
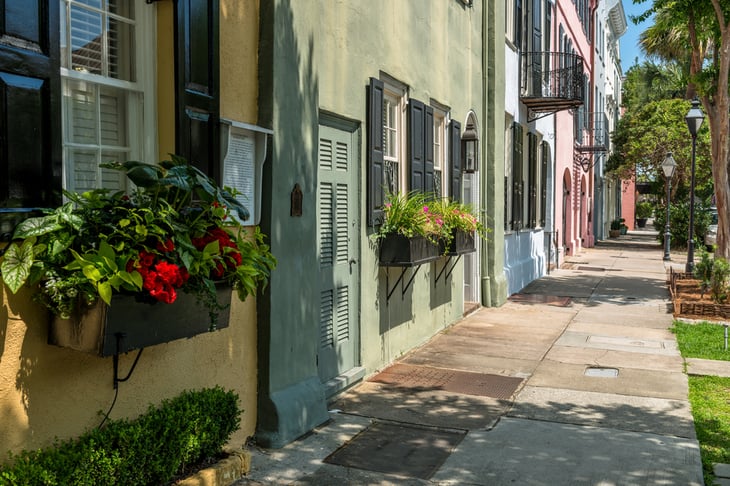
VantageScore: 660
Population: 4,961,119
Median household income: $45,483
Residents aged 25+ with at least 4-year college degree: 25.8 percent
46. Texas

VantageScore: 660
Population: 27,862,596
Median household income: $53,207
Residents aged 25+ with at least 4-year college degree: 27.6 percent
47. Alabama

VantageScore: 657
Population: 4,863,300
Median household income: $43,623
Residents aged 25+ with at least 4-year college degree: 23.5 percent
Just over 17 percent of the residents of Alabama live in poverty.
48. Nevada

VantageScore: 657
Population: 2,940,058
Median household income: $51,847
Residents aged 25+ with at least 4-year college degree: 23 percent
Nevada has the country’s highest rate of underwater mortgages. According to Credit.com, 17.4 percent of dwellings there have loans 25 percent higher than the property’s value.
49. Georgia

VantageScore: 656
Population: 10,310,371
Median household income: $49,620
Residents aged 25+ with at least 4-year college degree: 28.8 percent
50. Louisiana

VantageScore: 654
Population: 4,681,666
Median household income: $45,047
Residents aged 25+ with at least 4-year college degree: 22.5 percent
Louisiana has a problem with underwater mortgages. According to Credit.com, 17.1 percent of homes there have loans that are at least 25 percent higher than the property’s value.
51. Mississippi

VantageScore: 648
Population: 2,988,726
Median household income: $39,665
Residents aged 25+ with at least 4-year college degree: 20.7 percent
The median net worth of Mississippi households ($35,302) is half that of U.S. households overall. The Magnolia State also has the nation’s highest 30-day auto loan delinquency rate, at 3.3 percent.
How does your credit score compare with others in your state? Share with us in comments below or on our Facebook page.


Add a Comment
Our Policy: We welcome relevant and respectful comments in order to foster healthy and informative discussions. All other comments may be removed. Comments with links are automatically held for moderation.