


Editor's Note: This story originally appeared on ETQ.
After decades of offshoring, the United States is attempting a manufacturing revival.
Under the Biden administration, federal programs like the CHIPS and Science Act, the Inflation Reduction Act, and the Infrastructure Investment and Jobs Act directed hundreds of billions toward reshoring critical industries.
More recently, President Donald Trump’s sweeping tariff agenda has added new pressure to relocate production back to U.S. soil.
Together, these policies aim to rebuild domestic capacity in high-priority sectors such as semiconductors, pharmaceuticals, and clean energy. Across the country, companies are pouring money into new factories and expansion projects, with federal leaders frequently touting job creation as a central outcome of this industrial strategy.
But while reshoring may help reverse some losses, it is unlikely to restore manufacturing employment to its former scale.
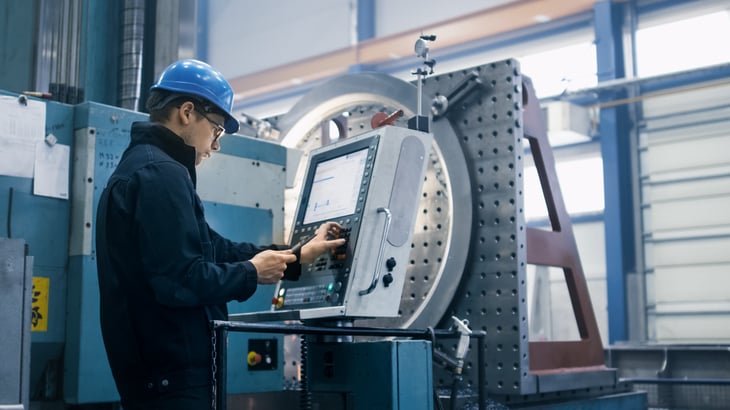
The modern factory floor is leaner and more automated than in decades past. The number of U.S. workers employed in manufacturing has dropped sharply over the last two decades — even as output has continued to grow.
To assess the full picture, researchers at ETQ, a management platform for the manufacturing sector, analyzed data from the U.S. Bureau of Labor Statistics (BLS) and the Bureau of Economic Analysis (BEA), examining how manufacturing jobs have changed nationwide. Learn about the methodology at the end.
Following are the states that have lost the most manufacturing jobs since 2000.
15. Ohio

- Percentage change in manufacturing employment: -33.3%
- Percentage change in manufacturing GDP: +7.8%
- Percentage change in total employment: +0.1%
- Total change in manufacturing employment: -341,169
- Total manufacturing employment (2000): 1,023,444
- Total manufacturing employment (2024): 682,275
- Manufacturing as a share of total employment (2000): 21.4%
- Manufacturing as a share of total employment (2024): 14.3%
14. Illinois

- Percentage change in manufacturing employment: -33.5%
- Percentage change in manufacturing GDP: +25.8%
- Percentage change in total employment: +1.9%
- Total change in manufacturing employment: -290,734
- Total manufacturing employment (2000): 868,902
- Total manufacturing employment (2024): 578,168
- Manufacturing as a share of total employment (2000): 16.9%
- Manufacturing as a share of total employment (2024): 11.0%
13. Connecticut

- Percentage change in manufacturing employment: -33.7%
- Percentage change in manufacturing GDP: +16.4%
- Percentage change in total employment: -0.2%
- Total change in manufacturing employment: -79,205
- Total manufacturing employment (2000): 234,790
- Total manufacturing employment (2024): 155,585
- Manufacturing as a share of total employment (2000): 16.1%
- Manufacturing as a share of total employment (2024): 10.7%
12. Pennsylvania

- Percentage change in manufacturing employment: -34.7%
- Percentage change in manufacturing GDP: -2.4%
- Percentage change in total employment: +10.1%
- Total change in manufacturing employment: -299,027
- Total manufacturing employment (2000): 862,069
- Total manufacturing employment (2024): 563,042
- Manufacturing as a share of total employment (2000): 17.8%
- Manufacturing as a share of total employment (2024): 10.5%
11. Maine

- Percentage change in manufacturing employment: -34.8%
- Percentage change in manufacturing GDP: +12.8%
- Percentage change in total employment: +10.4%
- Total change in manufacturing employment: -27,642
- Total manufacturing employment (2000): 79,461
- Total manufacturing employment (2024): 51,819
- Manufacturing as a share of total employment (2000): 16.0%
- Manufacturing as a share of total employment (2024): 9.5%
10. Maryland

- Percentage change in manufacturing employment: -35.0%
- Percentage change in manufacturing GDP: +69.9%
- Percentage change in total employment: +13.4%
- Total change in manufacturing employment: -60,782
- Total manufacturing employment (2000): 173,643
- Total manufacturing employment (2024): 112,861
- Manufacturing as a share of total employment (2000): 8.8%
- Manufacturing as a share of total employment (2024): 5.1%
9. Delaware

- Percentage change in manufacturing employment: -36.0%
- Percentage change in manufacturing GDP: +28.1%
- Percentage change in total employment: +15.2%
- Total change in manufacturing employment: -14,991
- Total manufacturing employment (2000): 41,652
- Total manufacturing employment (2024): 26,661
- Manufacturing as a share of total employment (2000): 11.7%
- Manufacturing as a share of total employment (2024): 6.5%

8. Mississippi

- Percentage change in manufacturing employment: -36.4%
- Percentage change in manufacturing GDP: +30.5%
- Percentage change in total employment: +2.3%
- Total change in manufacturing employment: -80,772
- Total manufacturing employment (2000): 222,119
- Total manufacturing employment (2024): 141,347
- Manufacturing as a share of total employment (2000): 24.3%
- Manufacturing as a share of total employment (2024): 15.1%
7. North Carolina

- Percentage change in manufacturing employment: -38.5%
- Percentage change in manufacturing GDP: +9.6%
- Percentage change in total employment: +28.6%
- Total change in manufacturing employment: -292,072
- Total manufacturing employment (2000): 757,711
- Total manufacturing employment (2024): 465,639
- Manufacturing as a share of total employment (2000): 23.3%
- Manufacturing as a share of total employment (2024): 11.1%
6. New Jersey

- Percentage change in manufacturing employment: -38.6%
- Percentage change in manufacturing GDP: -5.6%
- Percentage change in total employment: +10.8%
- Total change in manufacturing employment: -158,975
- Total manufacturing employment (2000): 411,878
- Total manufacturing employment (2024): 252,903
- Manufacturing as a share of total employment (2000): 12.4%
- Manufacturing as a share of total employment (2024): 6.9%
5. West Virginia

- Percentage change in manufacturing employment: -39.1%
- Percentage change in manufacturing GDP: -4.9%
- Percentage change in total employment: +1.6%
- Total change in manufacturing employment: -29,564
- Total manufacturing employment (2000): 75,632
- Total manufacturing employment (2024): 46,068
- Manufacturing as a share of total employment (2000): 13.7%
- Manufacturing as a share of total employment (2024): 8.2%
4. Vermont

- Percentage change in manufacturing employment: -40.6%
- Percentage change in manufacturing GDP: +26.2%
- Percentage change in total employment: +3.0%
- Total change in manufacturing employment: -18,725
- Total manufacturing employment (2000): 46,158
- Total manufacturing employment (2024): 27,433
- Manufacturing as a share of total employment (2000): 18.6%
- Manufacturing as a share of total employment (2024): 10.7%
3. Massachusetts

- Percentage change in manufacturing employment: -43.4%
- Percentage change in manufacturing GDP: +75.7%
- Percentage change in total employment: +11.8%
- Total change in manufacturing employment: -177,403
- Total manufacturing employment (2000): 408,532
- Total manufacturing employment (2024): 231,129
- Manufacturing as a share of total employment (2000): 14.3%
- Manufacturing as a share of total employment (2024): 7.2%
2. Rhode Island

- Percentage change in manufacturing employment: -43.9%
- Percentage change in manufacturing GDP: 0.0%
- Percentage change in total employment: +7.1%
- Total change in manufacturing employment: -31,166
- Total manufacturing employment (2000): 71,059
- Total manufacturing employment (2024): 39,893
- Manufacturing as a share of total employment (2000): 17.6%
- Manufacturing as a share of total employment (2024): 9.2%
1. New York

- Percentage change in manufacturing employment: -44.6%
- Percentage change in manufacturing GDP: +4.7%
- Percentage change in total employment: +16.1%
- Total change in manufacturing employment: -330,794
- Total manufacturing employment (2000): 741,946
- Total manufacturing employment (2024): 411,152
- Manufacturing as a share of total employment (2000): 10.5%
- Manufacturing as a share of total employment (2024): 5.0%
Methodology

Data for this analysis comes from the U.S. Bureau of Labor Statistics (BLS) Quarterly Census of Employment and Wages (QCEW) and the U.S. Bureau of Economic Analysis (BEA) GDP by State dataset. Changes were analyzed from 2000 to 2024.
Only private-sector employment was included. Changes in GDP were inflation-adjusted using real chained-dollar values. Only states with complete data from both sources were included.

Add a Comment