


No matter which state you live in, you may be rubbing shoulders with millionaires.
Some were born to family wealth, some earned their cold hard cash with no help from Mom and Dad, and some may have just gotten lucky.
Many of the world’s richest are famous, such as Bill Gates, President Donald Trump or Kylie Jenner. But many millionaires are relatively unknown. You might admire their fancy cars on the freeway, wonder how some people manage to travel so much or stroll admiringly past a gated mansion, never knowing who lives inside.
And you might be surprised by which states top the most-millionaires-by-capita list. Using data available through the end of 2017, Phoenix Marketing International compiled a list ranking all states and D.C. (No, the No.1 state isn’t California or New York.) Remember, this list doesn’t say which state simply has the most millionaires, but which has the most as a proportion of the state’s population.
Take a trip through the state-by-state standings here, starting with the state with least millionaires per capita. Including the District of Columbia, there are 51 spots in the ranking.
51. Mississippi

Total households: 1,134,578
Households with $1 million or more in investable assets: 45,771
Percentage of millionaire households: 4.03 percent
Mississippi has been at the bottom of the list since 2013. In 2012, it landed at No. 50, pulling just ahead of Arkansas.
50. West Virginia

Total households: 763,797
Households with $1 million or more in investable assets: 32,082
Percentage of millionaire households: 4.20 percent
West Virginia may be low on the list, but its share of millionaires ticked upward a bit from 2016, when that was 4.08 percent. The richest person in the state is none other than Mississippi Gov. Jim Justice II, according to Forbes.
49. Arkansas
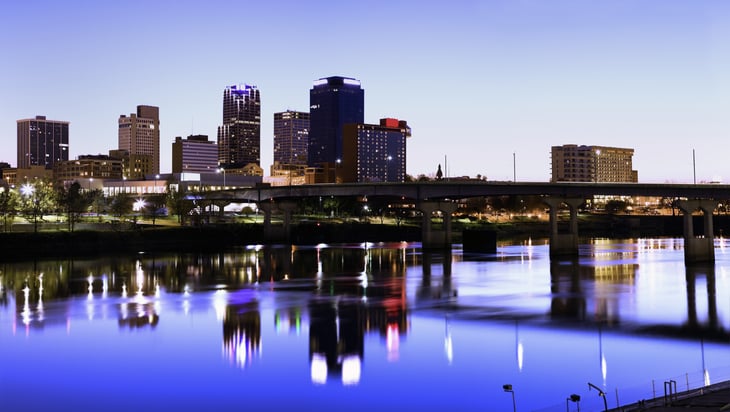
Total households: 1,178,438
Households with $1 million or more in investable assets: 50,106
Percentage of millionaire households: 4.25 percent
Arkansas may be low on the millionaire-per-capita list, but it’s home to the world’s largest company by revenue, massive discount-store chain Walmart.
48. Kentucky

Total households: 1,768,852
Households with $1 million or more in investable assets: 79,205
Percentage of millionaire households: 4.48 percent
Not everyone in Kentucky can afford to raise a Derby-winning thoroughbred. The state has fluctuated a bit on the list, but even reaching back to 2010, the Bluegrass State has stayed in the bottom five for millionaires per capita.
47. Alabama
Total households: 1,928,669
Households with $1 million or more in investable assets: 88,880
Percentage of millionaire households: 4.61 percent
Sweet Home Alabama doesn’t have a lot of millionaires per capita, but it ranked as high as No. 41 on the list back in 2013.
46. Tennessee

Total households: 2,625,681
Households with $1 million or more in investable assets: 122,585
Percentage of millionaire households: 4.67 percent
Tennessee is fairly low on the millionaire-per-capita list, but some of those millionaires are probably household names; Nashville and Memphis are known for their country music superstars.
45. Idaho

Total households: 625,834
Households with $1 million or more in investable assets: 30,110
Percentage of millionaire households: 4.81 percent
Scenic Idaho doesn’t have either a huge population or an especially large concentration of millionaires. In fact, according to Kiplinger.com, many of the state’s millionaires live in the part of the greater Jackson, Wyoming, area that spills into Idaho.
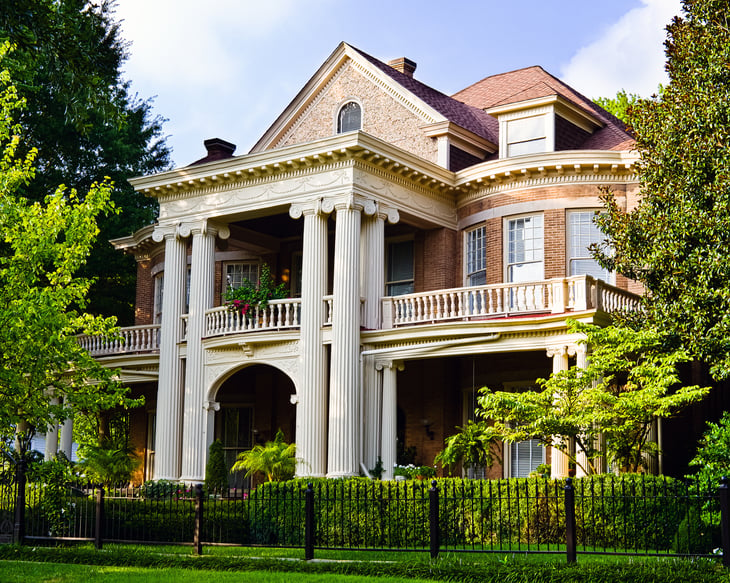
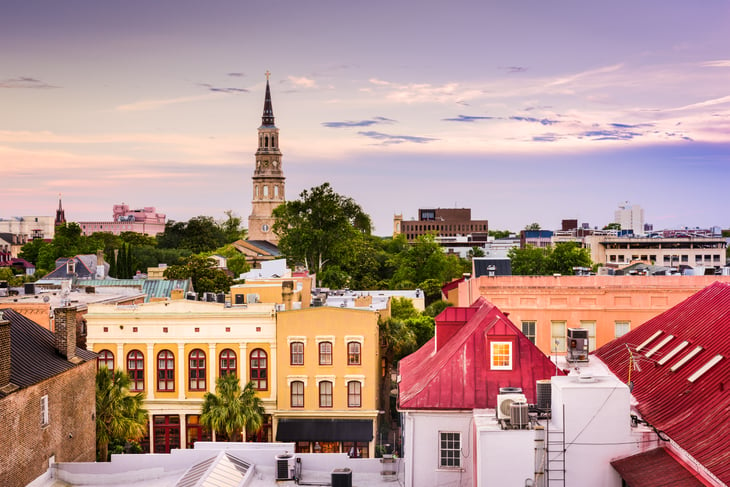
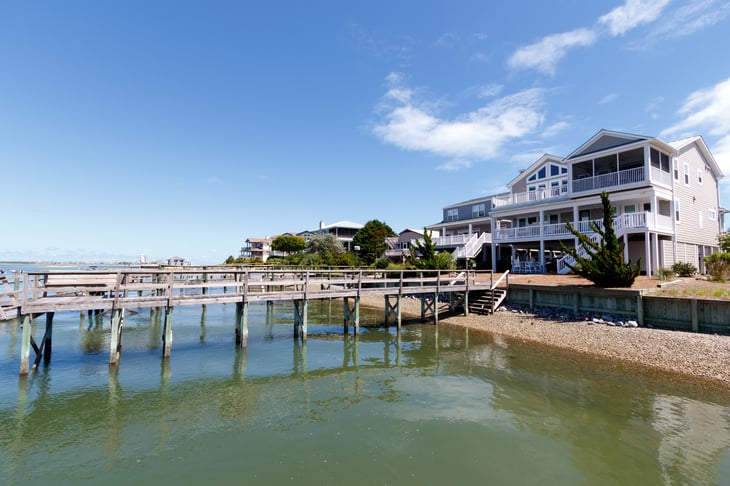
44. South Carolina
Total households: 1,960,255
Households with $1 million or more in investable assets: 94,675
Percentage of millionaire households: 4.83 percent
South Carolina comes in at No. 44 on the list for the second straight year.
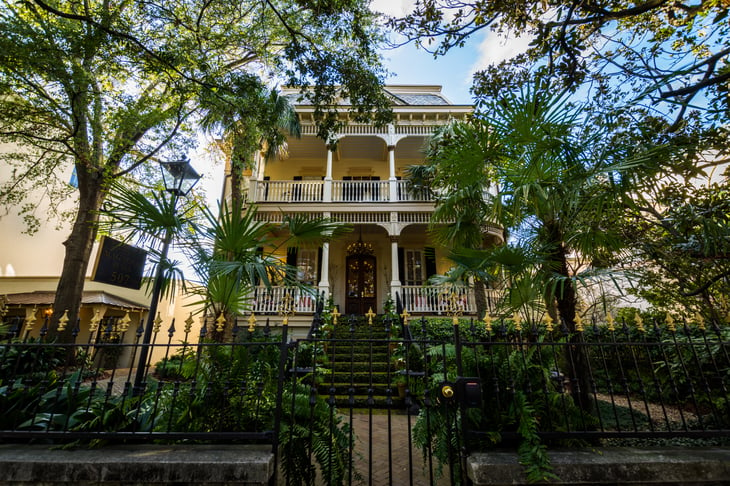
43. Louisiana
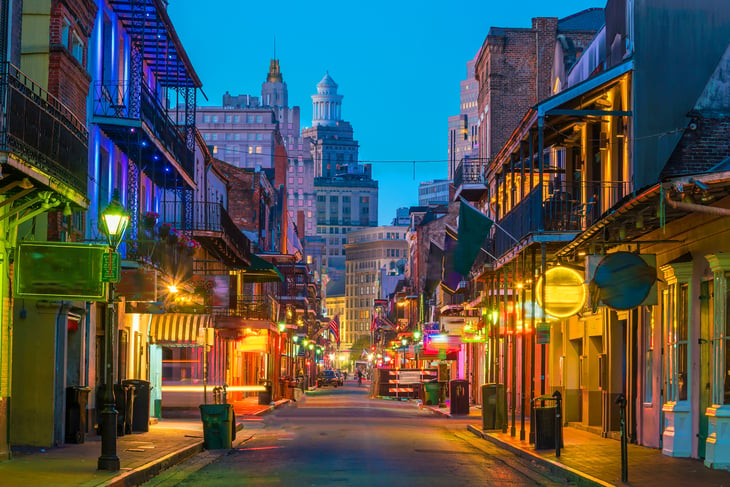
Total households: 1,818,504
Households with $1 million or more in investable assets: 88,371
Percentage of millionaire households: 4.86 percent
Millionaires in Louisiana can buy a lot of frozen daiquiris on New Orleans’ famed Bourbon Street.
42. North Carolina
Total households: 4,019,126
Households with $1 million or more in investable assets: 196,094
Percentage of millionaire households: 4.88 percent
North Carolina, the Tar Heel State, has 100,000 more millionaires than neighboring South Carolina, but because it also has a larger population, the two states are close on this list.
41. New Mexico

Total households: 810,609
Households with $1 million or more in investable assets: 40,031
Percentage of millionaire households: 4.94 percent
One famous millionaire in the Land of Enchantment? Author George R.R. Martin, whose book series “A Song of Ice and Fire” is the basis for HBO’s blockbuster hit show “Game of Thrones.”
40. Montana

Total households: 441,222
Households with $1 million or more in investable assets: 21,953
Percentage of millionaire households: 4.98 percent
Within Montana’s small population there is also a small number of millionaires. Put it this way: For every millionaire in Big Sky Country, California has 42.
39. Oklahoma

Total households: 1,543,599
Households with $1 million or more in investable assets: 76,819
Percentage of millionaire households: 4.98 percent
Percentage-wise, Oklahoma and Montana are in a dead heat as far as millionaires per capita, though Oklahoma has many more people.
38. Indiana

Total households: 2,575,466
Households with $1 million or more in investable assets: 128,600
Percentage of millionaire households: 4.99 percent
Indiana moved up two spots on the list from 2016, when its millionaires per capita made it No. 40.
37. Missouri
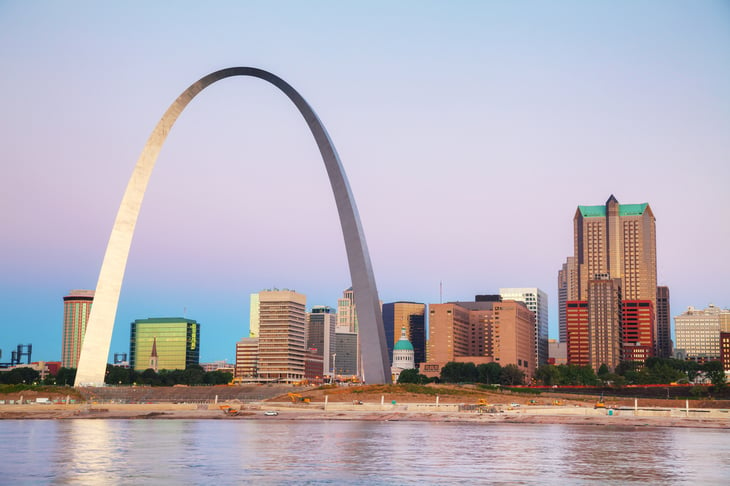
Total households: 2,439,229
Households with $1 million or more in investable assets: 122,323
Percentage of millionaire households: 5.01 percent
Counting from the bottom up, Missouri is the first state to push over 5 percent as far as concentration of millionaires.
36. South Dakota

Total households: 349,397
Households with $1 million ore more in investable assets: 17,772
Percentage of millionaire households: 5.09 percent
South Dakota, home of Mount Rushmore, the Black Hills, the Corn Palace and Wall Drug has more than 17,000 households in the millionaire bracket.
35. Nevada

Total households: 1,096,916
Households with $1 million or more in investable assets: 56,452
Percentage of millionaire households: 5.15 percent
Most visitors to Nevada’s famed gaming cities, such as Las Vegas, Laughlin and Reno, can only dream of hitting it big enough to join the millionaire list.
34. Maine
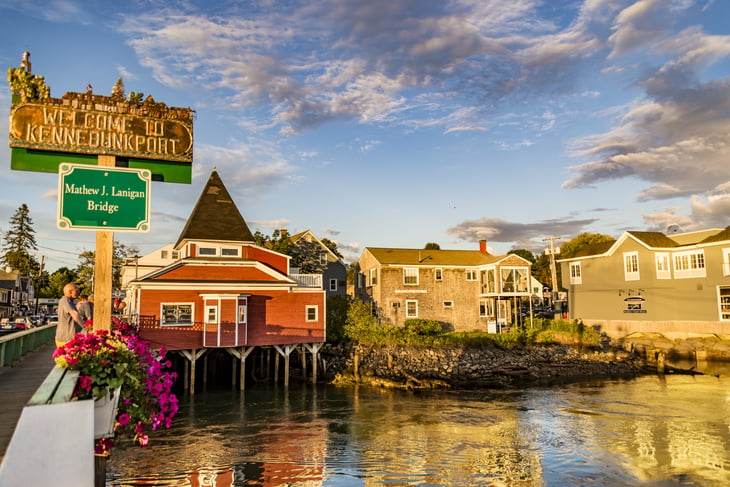
Total households: 565,293
Households with $1 million or more in investable assets: 29,301
Percentage of millionaire households: 5.18 percent
One of the most famous millionaires in scenic Maine might give you nightmares. Horror author Stephen King has earned over $433 million in his long career, Forbes reports.
33. Ohio
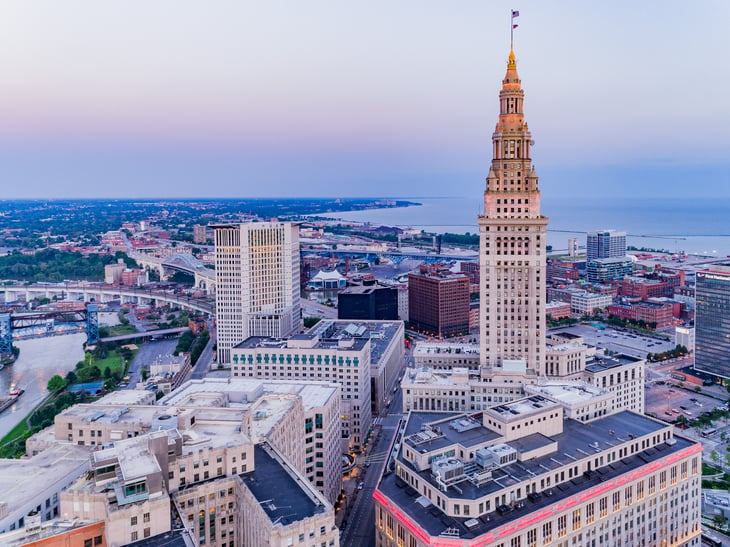
Total households: 4,685,647
Households with $1 million or more in investable assets: 243,118
Percentage of millionaire households: 5.19 percent
Ohio is home to the Rock & Roll Hall of Fame, whose members include plenty of millionaires — Ohioans and otherwise. The state comes in at No. 33 in this 2017 ranking, a two-spot drop from 2016.
32. Georgia
Total households: 3,854,460
Households with $1 million or more in investable assets: 200,395
Percentage of millionaire households: 5.20 percent
The Peach State is moving up on the list, from No. 37 in 2015 to No. 34 in 2016, and now to No. 32.
31. Florida
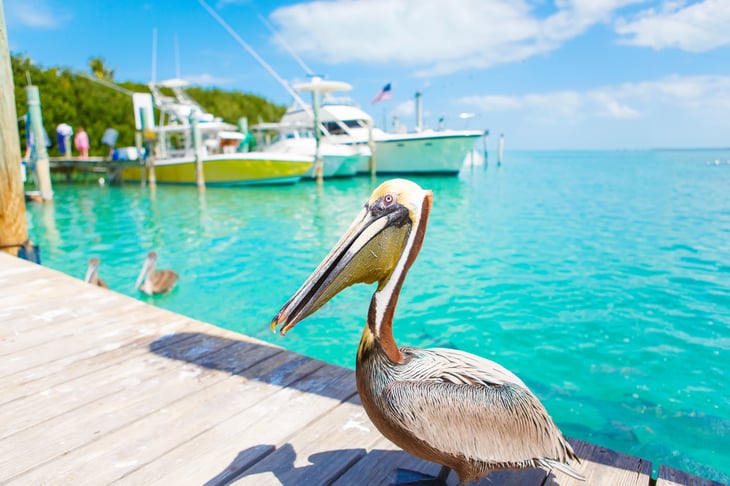
Total households: 8,173,428
Households with $1 million or more in investable assets: 427,824
Percentage of millionaire households: 5.23 percent
Florida is only at No. 31 on the list — surprising, considering it’s such a popular retirement destination for America’s wealthy. Kiplinger.com notes that the number of millionaires per capita in one enormous Florida retirement community, The Villages, is among the highest in the country.
30. Arizona
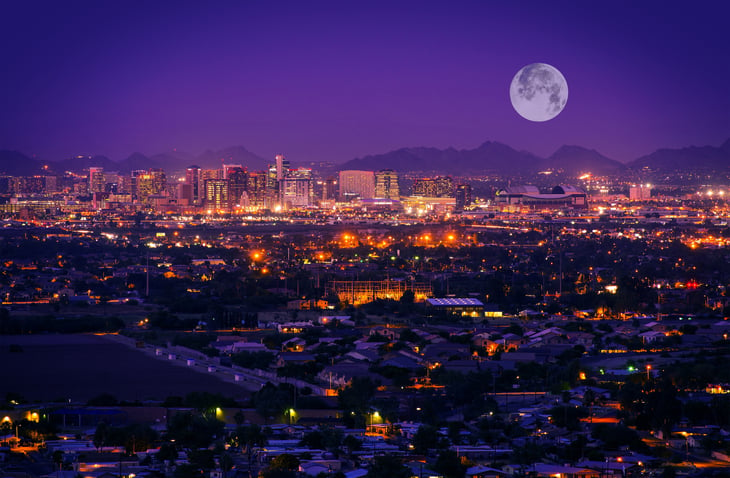
Total households: 2,595,635
Households with $1 million or more in investable assets: 137,359
Percentage of millionaire households: 5.29 percent
Arizona is also a retirement haven, especially for the wealthy. The Grand Canyon State leaped five places on the millionaire-per-capita list in just one year.
29. Michigan

Total households: 3,939,976
Households with $1 million or more in investable assets: 210,957
Percentage of millionaire households: 5.35 percent
When you think of Michigan millionaires, you might think of auto-company execs and Motown musicians. The very richest in the state, according to Forbes, are the grocery store chain magnates Hank and Doug Meijer. Michigan is also home to the co-founder of Little Caesar’s Pizza.
28. Wisconsin
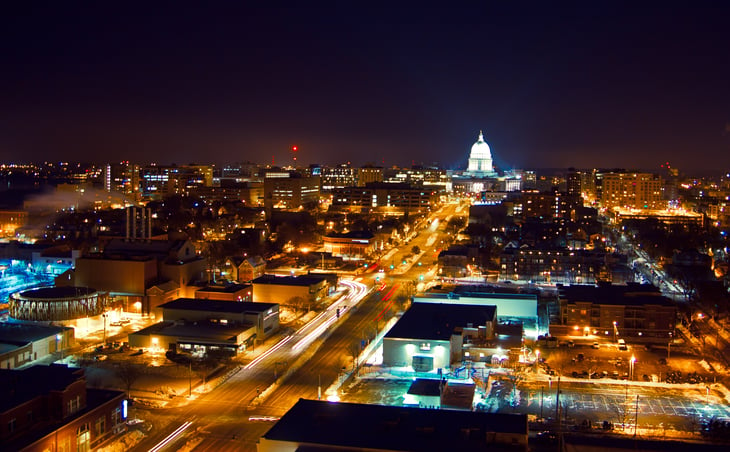
Total households: 2,354,510
Households with $1 million or more in investable assets: 127,260
Percentage of millionaire households: 5.40 percent
The Badger State of Wisconsin comes in fairly close to neighboring Michigan on the list. But just over the border in Minnesota, there’s a much higher percentage of millionaires per capita.
27. Kansas

Total households: 1,144,287
Households with $1 million or more in investable assets: 62,168
Percentage of millionaire households: 5.43 percent
The Sunflower State fell two spots on the list of millionaires per capita this year, dropping to No. 27 from No. 25.
26. Nebraska

Total households: 760,510
Households with $1 million or more in investable assets: 41,348
Percentage of millionaire households: 5.44 percent
Nebraska is home to Berkshire Hathaway chairman Warren Buffett, one of the world’s wealthiest people who has a net worth of more than $80 billion. The 88-year-old investor still lives in the Omaha home he bought in 1956 for $31,500.
25. Oregon

Total households: 1,639,493
Households with $1 million or more in investable assets: 89,383
Percentage of millionaire households: 5.45 percent
Just shoe it: If you wear Nike shoes, thank Oregon’s richest resident, company founder Phil Knight, who’s worth more than $30 billion.
24. Iowa

Total households: 1,270,566
Households with $1 million or more in investable assets: 71,212
Percentage of millionaire households: 5.60 percent
You may not think of bucolic Iowa as a place millionaires would stake their claims, but the Hawkeye State settles comfortably in the middle of the list.
23. Texas
Total households: 10,005,417
Households with $1 million or more in investable assets: 566,578
Percentage of millionaire households: 5.66 percent
Texas is home to more than a half-million millionaire households. In sheer numbers, it ranks second only to California. There are about as many millionaire households in the Lone Star State as there are people in Wyoming.
22. Pennsylvania

Total households: 5,099,166
Households with $1 million or more in investable assets: 294,002
Percentage of millionaire households: 5.77 percent
Pennsylvania claimed the No. 22 spot for the second year in a row. Architect Frank Lloyd Wright’s famous Fallingwater, shown in the photo, was built in rural southwestern Pennsylvania in 1935 as a weekend home for the owners of Kaufmann’s Department Store for $155,000 (equivalent to about $2.7 million today).
21. Vermont
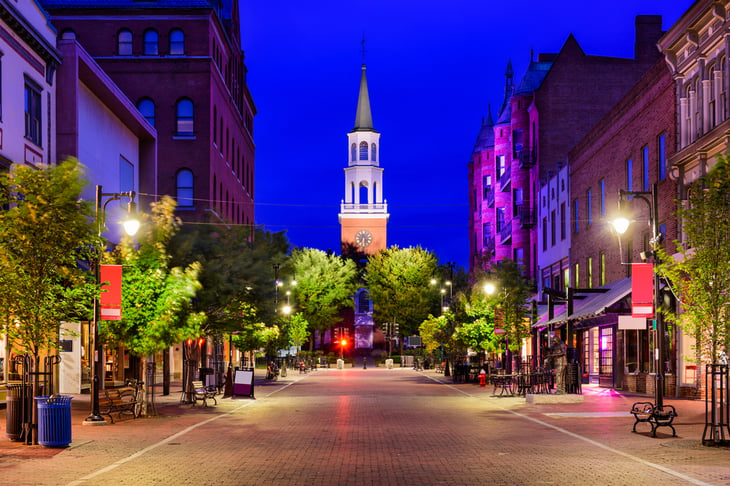
Total households: 261,095
Households with $1 million or more in investable assets: 15,363
Percentage of millionaire households: 5.88 percent
Vermont’s not a large state by population, but it still boasts a decent ranking on the millionaires per capita list. Two famous Vermonter millionaires are politically active ice-cream moguls Ben Cohen and Jerry Greenfield.
20. North Dakota

Total households: 327,536
Households with $1 million or more in investable assets: 19,662
Percentage of millionaire households: 6 percent
Quiet North Dakota has seen many millionaires emerge from its oil industry, which has boomed since the start of this century.
19. Utah
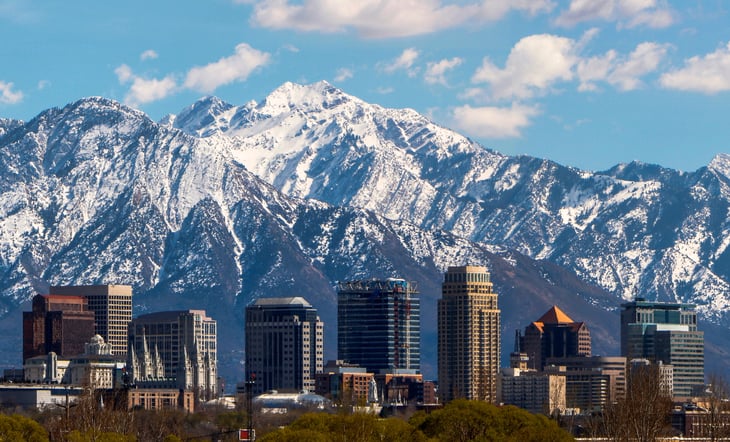
Total households: 978,826
Households with $1 million or more in investable assets: 59,390
Percentage of millionaire households: 6.07 percent
Want a rich neighbor? Check out Utah’s Summit Park, a small town with one of the highest concentrations of millionaires in the country, Kiplinger.com notes.
18. Illinois
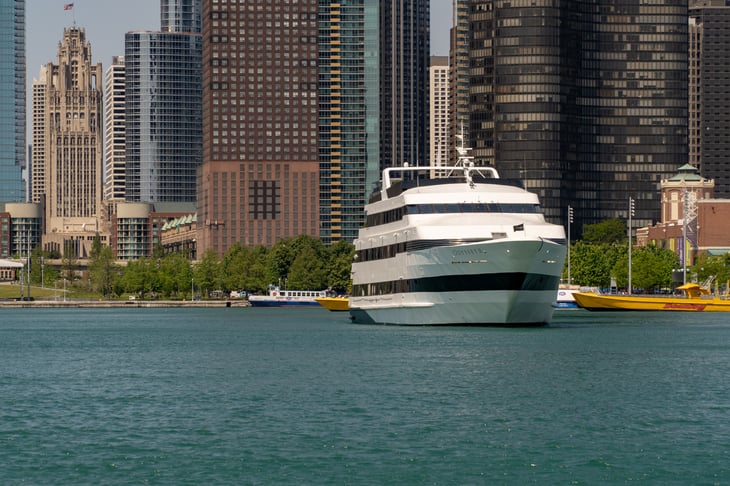
Total households: 4,886,159
Households with $1 million or more in investable assets: 300,142
Percentage of millionaire households: 6.14 percent
Illinois, the Land of Lincoln, dropped in the millionaires per capita ranking last year, falling two places from No. 16 in 2016.
17. New York
Total households: 7,568,120
Households with $1 million or more in investable assets: 465,479
Percentage of millionaire households: 6.15 percent
New Yorkers almost need to be millionaires to own a home in New York City, where, according to Zillow, the median price of a home is $674,500, and the median rent is $2,900. Of course, there is life in the state outside of New York City.
16. Rhode Island

Total households: 418,815
Households with $1 million or more in investable assets: 26,032
Percentage of millionaire households: 6.22 percent
Rhode Island might be small in size, but it soars pretty high on the millionaires per capita list.
15. Wyoming

Total households: 240,378
Households with $1 million or more in investable assets: 14,989
Percentage of millionaire households: 6.24 percent
Rustic Wyoming might not seem like a millionaire favorite, but thanks to its scenic locale and coal-production industry, it jumped from No. 20 in 2016 to No. 15 last year.
14. Colorado

Total households: 2,217,977
Households with $1 million or more in investable assets: 143,564
Percentage of millionaire households: 6.57 percent
Not everyone in Colorado can afford to retire to the ski slopes of spendy, trendy Aspen or Vail, but the state still landed at No.14 on the millionaires-per-capita list.
13. Washington
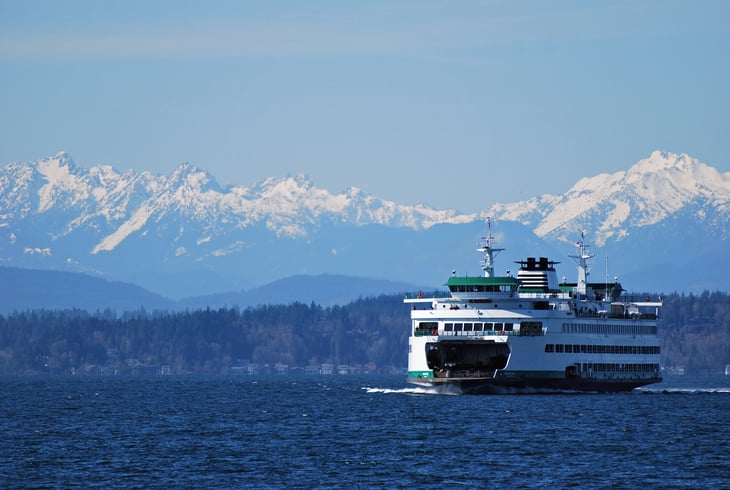
Total households: 2,865,392
Households with $1 million or more in investable assets: 186,396
Percentage of millionaire households: 6.51 percent
Microsoft co-founder Bill Gates and Amazon founder Jeff Bezos, both Evergreen State natives, have seen the stock of their two companies soar, helping Washington state create plenty of “regular” millionaires.
12. Minnesota
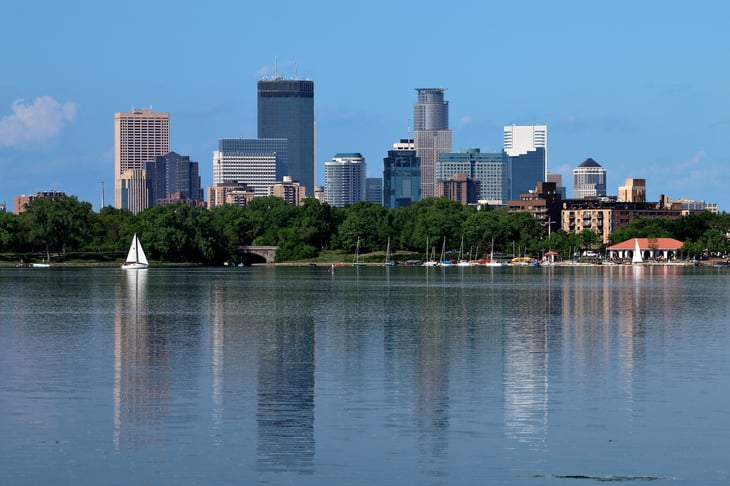
Total households: 2,206,236
Households with $1 million or more in investable assets: 144,944
Percentage of millionaire households: 6.57 percent
The Land of 10,000 Lakes is swimming with millionaire households. This is Minnesota’s second year coming in at No. 12 on the list.
11. District of Columbia
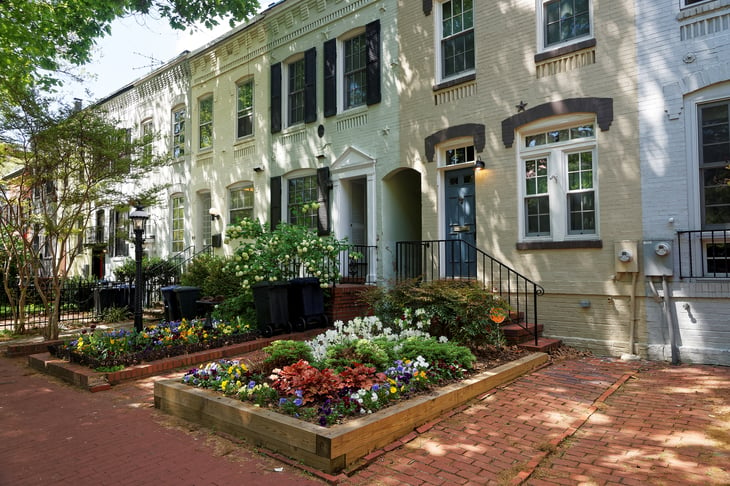
Total households: 312,546
Households with $1 million or more in investable assets: 20,534
Percentage of millionaire households: 6.57 percent
The nation’s capital attracts the powerful and wealthy from all states, whether elected to office or just seeking proximity to power. The current president, Donald Trump, is believed to be the richest U.S. president in history.
10. California
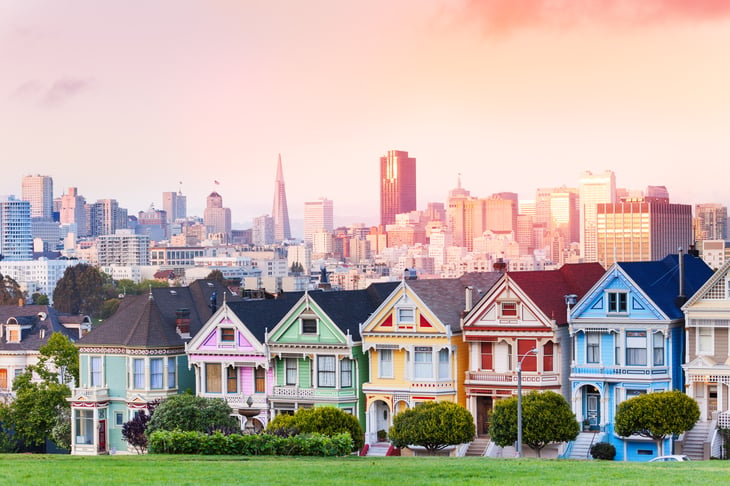
Total households: 13,384,483
Households with $1 million or more in investable assets: 885,225
Percentage of millionaire households: 6.61 percent
Sunny California collects millionaires from all walks of life, from famous actors to tech geniuses. It’s home to the most millionaires of any state, with 885,225.
9. Delaware

Total households: 365,666
Households with $1 million or more in investable assets: 24,212
Percentage of millionaire households: 6.62 percent
What did Della wear? If you’re talking about America’s First State, she might have worn a designer outfit decked out with jewels. The tiny Eastern state moved from No. 10 to No. 9 this year thanks to a growing concentration of millionaires.
8. Virginia

Total households: 3,242,493
Households with $1 million+ investable assets: 226,167
Percentage of millionaire households: 6.98 percent
Virginia is for lovers, the state’s iconic tourism slogan claims, but it’s also for the wealthy. This state next door to the nation’s capital has made the top 10 list of millionaires-per-capita states each year since 2010.
7. New Hampshire
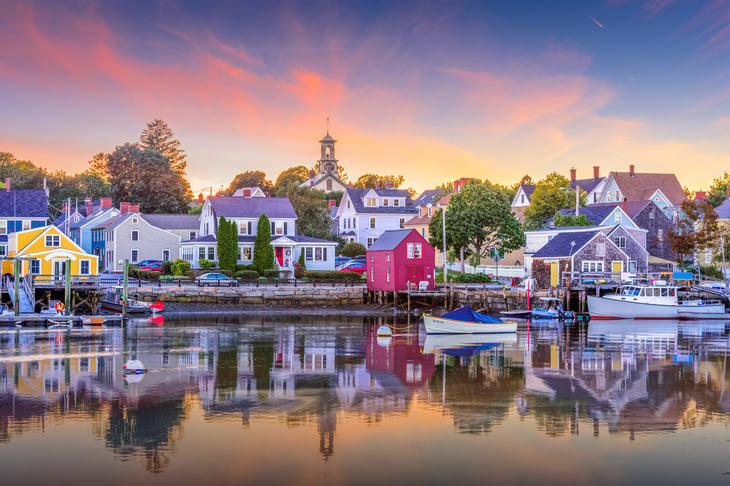
Total households: 532,376
Households with $1 million or more in investable assets: 39,209
Percentage of millionaire households: 7.36 percent
Scenic New Hampshire is slowly creeping up the list, from No. 9 in 2012 to No. 8 in 2014, and now to No. 7.
6. Massachusetts

Total households: 2,682,402
Households with $1 million or more in investable assets: 198,750
Percentage of millionaire households: 7.41 percent
Thanks to tech companies and its unparalleled collection of acclaimed universities, Massachusetts’ millionaires have almost pushed the Bay State into the top five.
5. Alaska
Total households: 272,496
Households with $1 million or more in investable assets: 20,444
Percentage of millionaire households: 7.50 percent
Alaskans have one monetary reward to count on — the state’s annual payout from an oil wealth trust fund. That doesn’t make everyone millionaires of course, but oil wealth has certainly helped the state land the No. 5 spot.
4. Hawaii
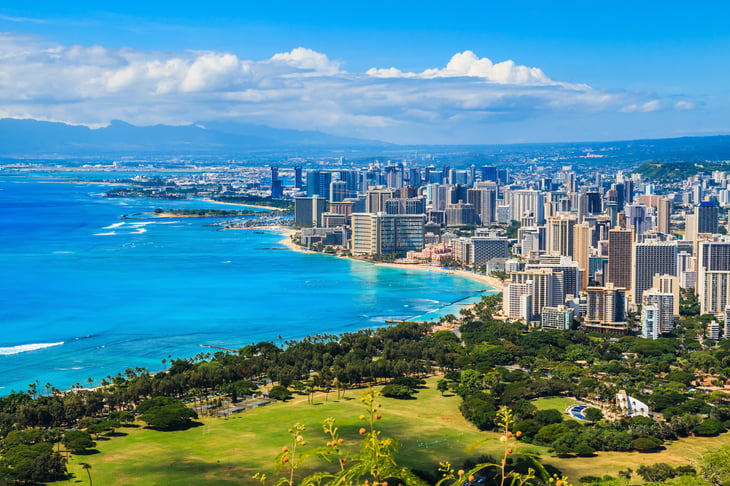
Total households: 487,708
Households with $1 million or more in investable assets: 36,903
Percentage of millionaire households: 7.57 percent
What could be better than living in paradise? Well, as pricey as Hawaii can be, it’s better to live in paradise and be a millionaire.
3. Connecticut

Total households: 1,379,979
Households with $1 million or more in investable assets: 106,892
Percentage of millionaire households: 7.75 percent
More than 100,000 households can call themselves millionaires in the Constitution State.
2. New Jersey

Total households: 3,294,365
Households with $1 million or more in investable assets: 258,988
Percentage of millionaire households: 7.86 percent
New Jersey is on the move. The Garden State trails only one state as far as millionaires per capita, up from No. 3 in 2016 and No. 4 in 2015.
1. Maryland
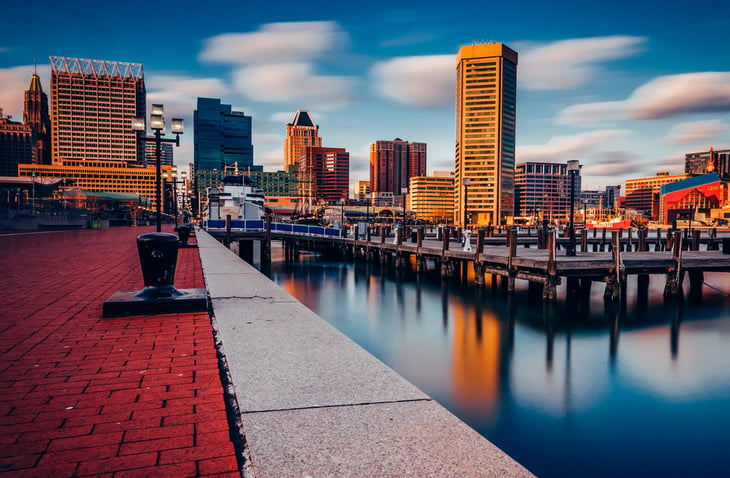
Total households: 2,263,021
Households with $1 million or more in investable assets: 178,003
Percentage of millionaire households: 7.87 percent
Were you surprised to find Maryland at the top of the list? The Old Line State is aided by its location, near the plentiful and powerful government jobs of the District of Columbia. It’s held the No. 1 spot since 2011, and in 2010 was second only to Hawaii.
How does your state measure up in terms of millionaires? How do these numbers compare with your perception? Share with us in comments below or on our Facebook page.
Add a Comment
Our Policy: We welcome relevant and respectful comments in order to foster healthy and informative discussions. All other comments may be removed. Comments with links are automatically held for moderation.