
Editor's Note: This story originally appeared on Construction Coverage.
After two years of stiff competition and fast-rising prices, the residential housing market in the U.S. began cooling quickly over the second half of 2022 and beginning of 2023.
Price growth exploded during the COVID-19 pandemic while interest rates were low, households savings and investment returns were high, and more people were spending time at home.
The volume of home sales has decelerated dramatically in recent months.
Despite the cooling in the real estate market, some regions continued to see relatively high levels of activity in 2022.
To identify locations where the housing market stayed hot in 2022, Construction Coverage developed a composite score using key indicators from Redfin about different local markets.
In the event of a tie, the location with the greater one-year change in median sale price was ranked higher. You can read more about our methodology at the end.
Here are the U.S. cities that had the hottest real estate markets of 2022.
15. Charlotte, NC

- Composite score: 54.3
- Median sale price: $390,537
- 1-year change in median sale price: +6.8%
- Share of homes that sold above asking: 48.9%
- Median number of days on the market: 31.2
- Average sale-to-list percentage: 101.4%
- Share of listings with price drops: 24.0%
14. Los Angeles, CA

- Composite score: 54.3
- Median sale price: $985,216
- 1-year change in median sale price: -4.2%
- Share of homes that sold above asking: 53.2%
- Median number of days on the market: 38.9
- Average sale-to-list percentage: 102.5%
- Share of listings with price drops: 17.1%
13. Oklahoma City, OK

- Composite score: 56.6
- Median sale price: $254,094
- 1-year change in median sale price: +7.6%
- Share of homes that sold above asking: 42.7%
- Median number of days on the market: 10.3
- Average sale-to-list percentage: 100.3%
- Share of listings with price drops: 26.9%
12. San Diego, CA

- Composite score: 56.7
- Median sale price: $869,443
- 1-year change in median sale price: -1.1%
- Share of homes that sold above asking: 52.4%
- Median number of days on the market: 15.9
- Average sale-to-list percentage: 102.2%
- Share of listings with price drops: 29.2%
11. Aurora, CO
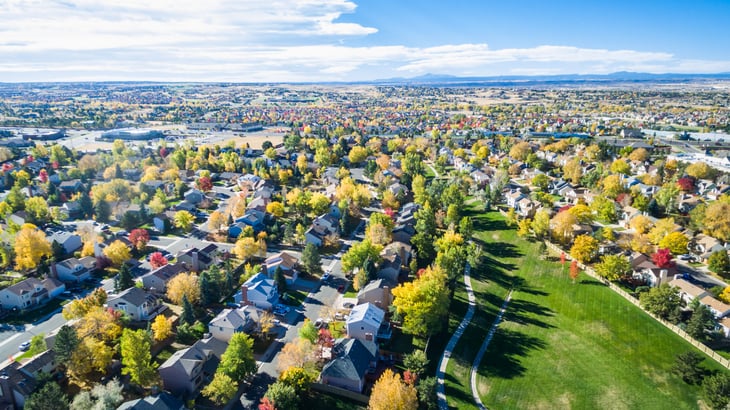
- Composite score: 57.0
- Median sale price: $476,319
- 1-year change in median sale price: -1.3%
- Share of homes that sold above asking: 54.5%
- Median number of days on the market: 10.7
- Average sale-to-list percentage: 102.4%
- Share of listings with price drops: 44.3%
10. Raleigh, NC

- Composite score: 58.9
- Median sale price: $410,604
- 1-year change in median sale price: -1.3%
- Share of homes that sold above asking: 55.6%
- Median number of days on the market: 30.8
- Average sale-to-list percentage: 103.1%
- Share of listings with price drops: 23.9%
9. Columbus, OH

- Composite score: 61.0
- Median sale price: $259,695
- 1-year change in median sale price: +6.4%
- Share of homes that sold above asking: 52.6%
- Median number of days on the market: 36.2
- Average sale-to-list percentage: 102.3%
- Share of listings with price drops: 20.9%
8. Seattle, WA
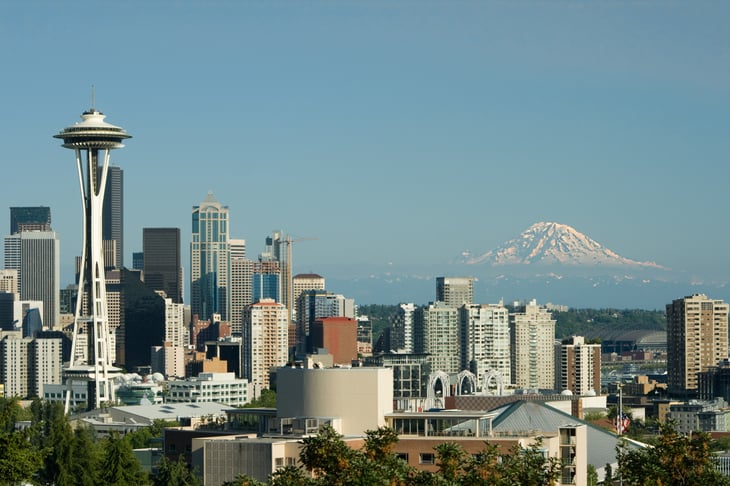
- Composite score: 61.5
- Median sale price: $844,285
- 1-year change in median sale price: +0.6%
- Share of homes that sold above asking: 42.7%
- Median number of days on the market: 11.0
- Average sale-to-list percentage: 103.5%
- Share of listings with price drops: 26.9%
7. Arlington, TX

- Composite score: 62.0
- Median sale price: $339,551
- 1-year change in median sale price: +10.0%
- Share of homes that sold above asking: 54.0%
- Median number of days on the market: 20.1
- Average sale-to-list percentage: 101.9%
- Share of listings with price drops: 30.9%
6. San Francisco, CA

- Composite score: 63.9
- Median sale price: $1,453,716
- 1-year change in median sale price: -12.8%
- Share of homes that sold above asking: 59.9%
- Median number of days on the market: 25.5
- Average sale-to-list percentage: 108.0%
- Share of listings with price drops: 19.3%
5. San Jose, CA
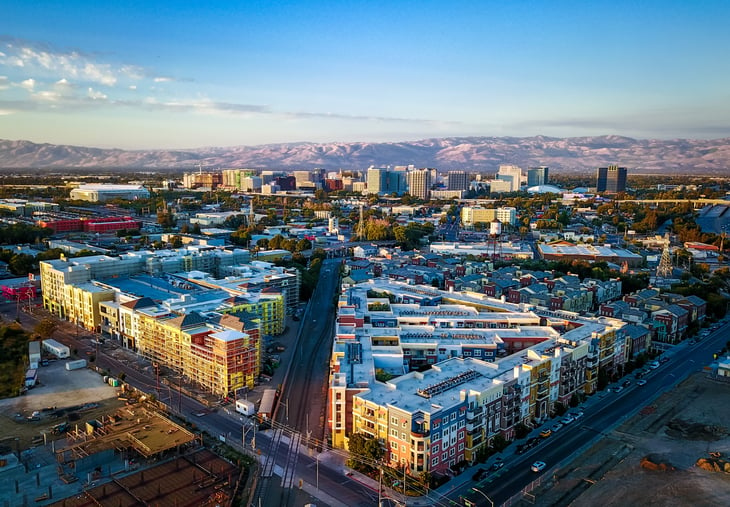
- Composite score: 64.8
- Median sale price: $1,330,942
- 1-year change in median sale price: -8.9%
- Share of homes that sold above asking: 65.9%
- Median number of days on the market: 16.6
- Average sale-to-list percentage: 106.9%
- Share of listings with price drops: 26.1%
4. El Paso, TX

- Composite score: 65.9
- Median sale price: $231,843
- 1-year change in median sale price: +9.3%
- Share of homes that sold above asking: 48.3%
- Median number of days on the market: 19.9
- Average sale-to-list percentage: 101.0%
- Share of listings with price drops: 16.6%
3. Omaha, NE

- Composite score: 68.6
- Median sale price: $254,817
- 1-year change in median sale price: +8.9%
- Share of homes that sold above asking: 51.8%
- Median number of days on the market: 7.8
- Average sale-to-list percentage: 102.1%
- Share of listings with price drops: 29.5%
2. Virginia Beach, VA

- Composite score: 69.5
- Median sale price: $336,786
- 1-year change in median sale price: +4.6%
- Share of homes that sold above asking: 54.9%
- Median number of days on the market: 19.2
- Average sale-to-list percentage: 101.6%
- Share of listings with price drops: 19.9%
1. Oakland, CA

- Composite score: 75.4
- Median sale price: $906,959
- 1-year change in median sale price: -0.9%
- Share of homes that sold above asking: 72.1%
- Median number of days on the market: 18.9
- Average sale-to-list percentage: 113.1%
- Share of listings with price drops: 22.6%
Methodology

The data used in this analysis is from Redfin’s Data Center.
To determine the locations that had the hottest real estate markets of 2022, researchers at Construction Coverage created a composite score, equally weighting the following metrics:
- One-year change in median sale price (Dec 2021–Dec 2022)
- Share of homes that sold above asking (2022)
- Median number of days on the market (2022)
- Average sale-to-list percentage (2022)
- Share of listings with price drops (2022)
In the event of a tie, the location with the greater one-year change in median sale price was ranked higher.
To improve relevance, only cities with at least 100,000 residents were included, and cities were grouped into cohorts based on population size. Note, only locations with complete data were considered for the analysis, and anomalous data were removed for quality purposes.


Add a Comment
Our Policy: We welcome relevant and respectful comments in order to foster healthy and informative discussions. All other comments may be removed. Comments with links are automatically held for moderation.