


Editor's Note: This story originally appeared on CoPilot.
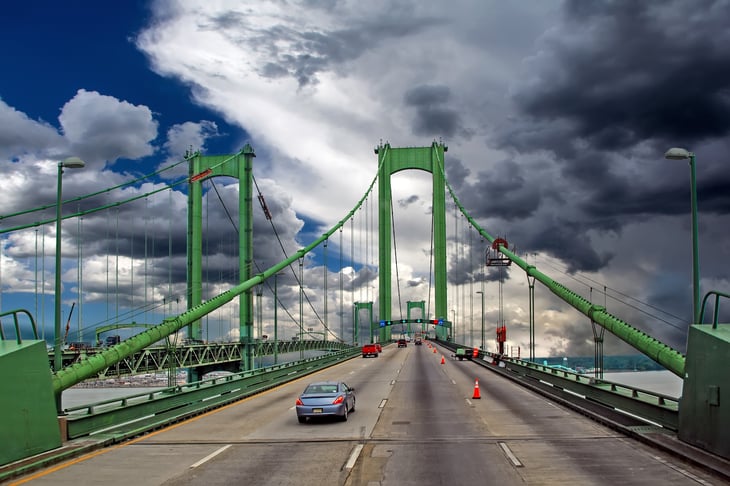
Car travel is a uniquely American obsession. Part of this fact is practical reality: In comparison with most other developed nations, the U.S. has a land area that is larger, cities that are less densely populated, and mass transit infrastructure that is less robust. As a result, the ability to travel by car is almost essential for getting around, and by most metrics of car usage, the U.S. outpaces its international peers.
But cars and road travel also occupy a special place in the public imagination, often associated with American ideals of freedom and exploration. The idea of being able to go anywhere at any time in America’s vast landscape is a powerful one. And this as much as cars’ utility in the U.S. has helped fuel high levels of car travel over the last century.
Americans’ car fixation can be seen in data from the Federal Highway Administration. Since 1960, the rate of growth for vehicle registrations has vastly outstripped the rate of growth of population. Initially, some of that trend could be attributed to rising economic prosperity and the growth of car-centric suburban communities in the postwar era. But now, the total number of registered vehicles in the U.S. exceeds the number of licensed drivers — by more than 50 million. This indicates a high number of multi-car households and even multi-car drivers.
With the increase in vehicles on the road comes more miles traveled. For the most part, the total number of miles traveled has also been on an upward trajectory over the last half-century, reaching a peak in 2019 at 271 billion vehicle-miles traveled. COVID-19 brought a major aberration, however: 2020 saw a 13% decline in miles traveled, the largest year-over-year decline on record. The pandemic led to job losses and a mass transition to remote work, which reduced commutes, while shutdowns and the need to social distance put a dent in tourism and travel for leisure purposes. It remains to be seen whether shifts in work and commuting patterns will have lasting effects on miles traveled or if 2020 proves to be an outlier.
The Top 15 Most Car-Dependent States

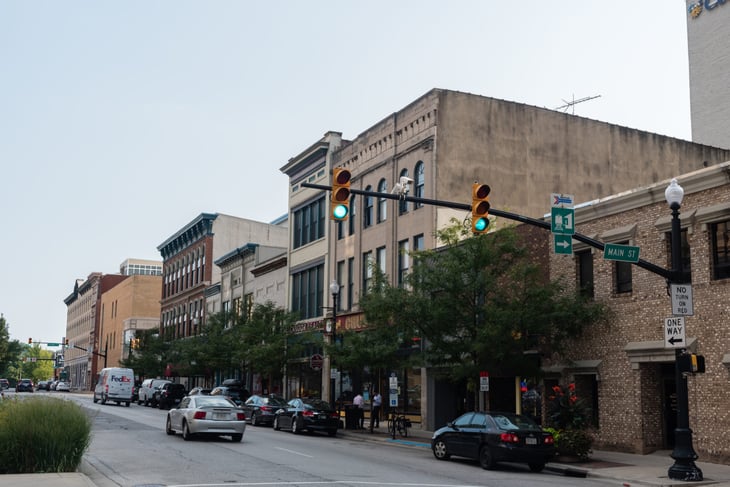
It is clear that for some states, car travel is not going anywhere anytime soon, regardless of the pandemic’s long-term effects. Many of the states where people drive the most miles are rural and not densely populated, so the use of cars is a necessity. The national leader is Wyoming — the nation’s second-least densely populated state — with more than 24,000 miles traveled per year per licensed driver. At the other end of the spectrum, Rhode Island is the second-most densely populated state and the state with the smallest land area, which both contribute to its low levels of driving.
Vehicle-miles traveled is one strong indication of how much states depend on cars, but it is not the only one. Other indicators can reflect how common vehicle ownership and travel are in a state’s households.
To find the locations most dependent on cars, researchers at Copilot used data from the Federal Highway Administration and the U.S. Census Bureau to develop a composite measure based on the annual vehicle-miles traveled per licensed driver (40%), the average number of vehicles per household (30%), the number of licensed drivers per 1,000 residents in the driving age population (15%), and the proportion of working adults with at least one vehicle available (15%).
Based on that formula, the following are the most car-dependent states.
15. South Carolina

- Composite score: 61.6
- Annual vehicle-miles traveled per licensed driver: 14,941
- Average number of vehicles per household: 0.87
- Licensed drivers per 1,000 driving-age population: 932
- Proportion of working adults with at least one vehicle available: 97.5%
14. Delaware
- Composite score: 61.7
- Annual vehicle-miles traveled per licensed driver: 12,609
- Average number of vehicles per household: 1.12
- Licensed drivers per 1,000 driving-age population: 1,024
- Proportion of working adults with at least one vehicle available: 97.2%
13. Indiana
- Composite score: 61.8
- Annual vehicle-miles traveled per licensed driver: 18,024
- Average number of vehicles per household: 0.84
- Licensed drivers per 1,000 driving-age population: 859
- Proportion of working adults with at least one vehicle available: 97.1%

12. Iowa

- Composite score: 61.9
- Annual vehicle-miles traveled per licensed driver: 14,745
- Average number of vehicles per household: 0.94
- Licensed drivers per 1,000 driving-age population: 906
- Proportion of working adults with at least one vehicle available: 97.5%
11. Idaho

- Composite score: 61.9
- Annual vehicle-miles traveled per licensed driver: 14,417
- Average number of vehicles per household: 0.91
- Licensed drivers per 1,000 driving-age population: 901
- Proportion of working adults with at least one vehicle available: 98.3%
10. Missouri

- Composite score: 63.1
- Annual vehicle-miles traveled per licensed driver: 18,521
- Average number of vehicles per household: 0.83
- Licensed drivers per 1,000 driving-age population: 868
- Proportion of working adults with at least one vehicle available: 97.3%
9. New Mexico

- Composite score: 63.3
- Annual vehicle-miles traveled per licensed driver: 19,157
- Average number of vehicles per household: 0.80
- Licensed drivers per 1,000 driving-age population: 865
- Proportion of working adults with at least one vehicle available: 97.9%
8. Kentucky

- Composite score: 64.0
- Annual vehicle-miles traveled per licensed driver: 16,305
- Average number of vehicles per household: 0.94
- Licensed drivers per 1,000 driving-age population: 847
- Proportion of working adults with at least one vehicle available: 97.3%
7. Nebraska

- Composite score: 65.0
- Annual vehicle-miles traveled per licensed driver: 14,846
- Average number of vehicles per household: 0.84
- Licensed drivers per 1,000 driving-age population: 947
- Proportion of working adults with at least one vehicle available: 98.2%
6. Utah
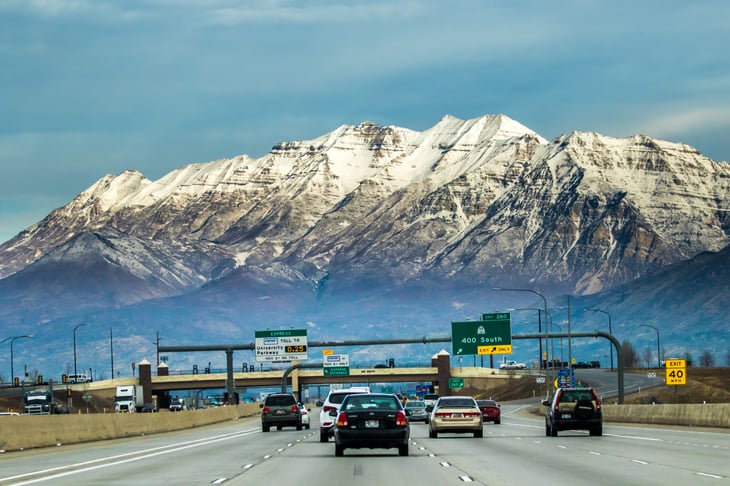
- Composite score: 65.7
- Annual vehicle-miles traveled per licensed driver: 15,516
- Average number of vehicles per household: 0.89
- Licensed drivers per 1,000 driving-age population: 892
- Proportion of working adults with at least one vehicle available: 98.1%
5. Georgia

- Composite score: 66.2
- Annual vehicle-miles traveled per licensed driver: 18,334
- Average number of vehicles per household: 0.89
- Licensed drivers per 1,000 driving-age population: 864
- Proportion of working adults with at least one vehicle available: 97.0%
4. South Dakota

- Composite score: 74.0
- Annual vehicle-miles traveled per licensed driver: 15,541
- Average number of vehicles per household: 0.95
- Licensed drivers per 1,000 driving-age population: 925
- Proportion of working adults with at least one vehicle available: 97.9%
3. Wyoming

- Composite score: 78.7
- Annual vehicle-miles traveled per licensed driver: 24,069
- Average number of vehicles per household: 0.83
- Licensed drivers per 1,000 driving-age population: 923
- Proportion of working adults with at least one vehicle available: 98.5%
2. Montana
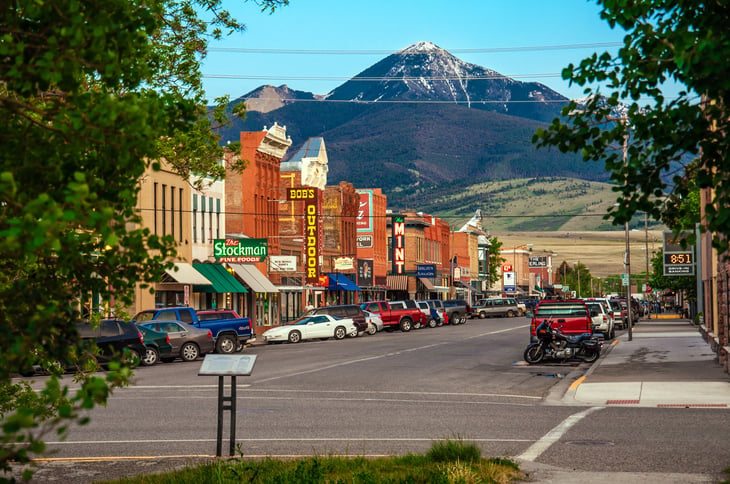
- Composite score: 81.4
- Annual vehicle-miles traveled per licensed driver: 15,880
- Average number of vehicles per household: 1.00
- Licensed drivers per 1,000 driving-age population: 938
- Proportion of working adults with at least one vehicle available: 98.1%
1. Alabama

- Composite score: 87.8
- Annual vehicle-miles traveled per licensed driver: 17,817
- Average number of vehicles per household: 1.09
- Licensed drivers per 1,000 driving-age population: 1,022
- Proportion of working adults with at least one vehicle available: 97.8%

Detailed Findings & Methodology

The data used in this analysis is from the Federal Highway Administration’s Highway Statistics Series and the U.S. Census Bureau’s American Community Survey, both with data from 2019. To determine the U.S. states most dependent on cars, researchers created a composite scored based on the following metrics with associated weights:
- Annual vehicle-miles traveled per licensed driver (40%)
- Average number of vehicles per household (30%)
- Licensed drivers per 1k driving-age population (15%)
- Proportion of working adults with at least one vehicle available (15%)
States were ranked by their composite scores as defined above. In the event of a tie, the state with the greater annual vehicle-miles traveled per licensed driver was ranked higher.
Add a Comment
Our Policy: We welcome relevant and respectful comments in order to foster healthy and informative discussions. All other comments may be removed. Comments with links are automatically held for moderation.