


Editor's Note: This story originally appeared on Dunhill Travel Deals.
As temperatures drop across much of the United States, many travelers begin planning a winter escape to warmer destinations. This year, the timing may be particularly favorable for budget-conscious vacationers.
According to recent data from the U.S. Bureau of Labor Statistics, average airfares have dropped in the years following the COVID-19 pandemic, offering relief from near-historic highs in 2022.
Combined with the travel lulls between Thanksgiving and the winter holidays, and again before spring break, winter can offer some of the year’s best opportunities to book an affordable vacation.
Meanwhile, warmer cities in the southern U.S. continue to attract interest not just for their mild temperatures but also for their comparatively low costs and strong tourism infrastructure.
To help travelers get the most for their money, researchers at Dunhill Travel Deals analyzed affordability across warm-weather destinations in the U.S. The analysis reviewed key travel expenses, including lodging, dining, local attractions, and climate-related appeal, to calculate a composite score for each city. Learn more about the methodology at the end.
The findings aim to help travelers stretch their budgets and discover unexpectedly affordable vacation spots this winter.
Keep reading for the best cities in the U.S. for an affordable warm-weather vacation.
10. New Orleans-Metairie, LA

- Composite score: 88.16
- Affordability score: 88.19
- Entertainment score: 91.90
- Average winter high temperature: 65.3
9. Slidell-Mandeville-Covington, LA

- Composite score: 88.32
- Affordability score: 94.63
- Entertainment score: 79.52
- Average winter high temperature: 65.4
8. Victoria, TX

- Composite score: 88.49
- Affordability score: 90.19
- Entertainment score: 82.07
- Average winter high temperature: 68.3
7. Port Lavaca, TX

- Composite score: 88.82
- Affordability score: 88.20
- Entertainment score: 87.85
- Average winter high temperature: 67.4

6. Sierra Vista-Douglas, AZ

- Composite score: 88.89
- Affordability score: 93.23
- Entertainment score: 81.02
- Average winter high temperature: 65.8
5. Kerrville, TX

- Composite score: 89.14
- Affordability score: 91.41
- Entertainment score: 92.95
- Average winter high temperature: 62.8
4. Kingsville, TX

- Composite score: 89.24
- Affordability score: 89.50
- Entertainment score: 86.10
- Average winter high temperature: 70.1
3. Okeechobee, FL

- Composite score: 89.44
- Affordability score: 97.31
- Entertainment score: 72.00
- Average winter high temperature: 74.8
2. Prescott Valley-Prescott, AZ

- Composite score: 90.18
- Affordability score: 95.66
- Entertainment score: 91.43
- Average winter high temperature: 61.9
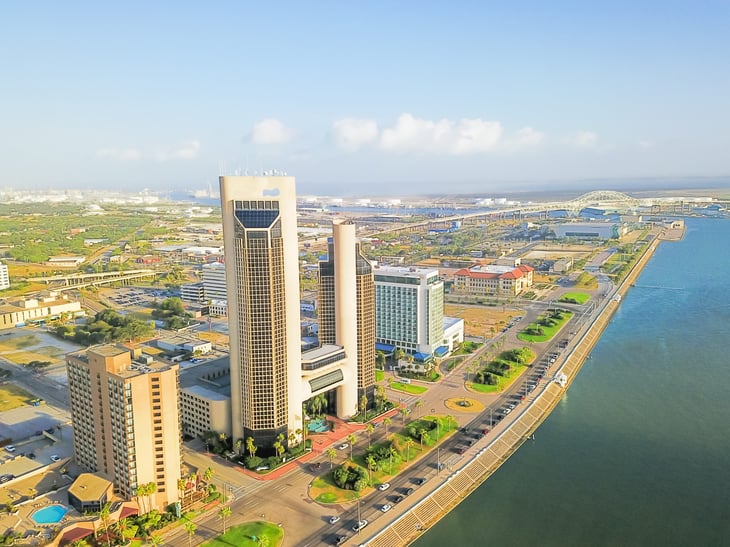
1. Corpus Christi, TX

- Composite score: 90.43
- Affordability score: 91.23
- Entertainment score: 86.80
- Average winter high temperature: 68.8
Methodology

The data used in this study is from the National Oceanic and Atmospheric Administration (NOAA)’s Climate at a Glance dataset, the U.S. General Services Administration (GSA)’s 2026 Per Diem Rates, the Bureau of Transportation Statistics (BTS)’s Q1 2025 Airline Origin & Destination Survey, the Bureau of Economic Analysis (BEA)’s 2023 Regional GDP & Personal Income dataset, and the U.S. Census Bureau’s 2023 County Business Patterns (CBP) dataset.
To determine the best U.S. metropolitan areas for an affordable warm-weather winter vacation, researchers at Dunhill Travel Deals formulated a composite score consisting of the following factors and weights:
- Average winter high temperature: 15% weight — calculated using NOAA data from December 2024–February 2025.
- Average nightly hotel rate: 15% weight — calculated by averaging GSA per diem data, which are formulated to best represent mid-range hotels in each market, from December 2025–February 2026.
- Average daily meals & incidentals: 15% weight — calculated by averaging GSA per diem data, which are formulated to represent the total cost of breakfast, lunch, dinner, and incidentals (tips), from December 2025–February 2026.
- Cost of services (compared to average): 15% weight — calculated using the latest regional price parities data from the BEA.
- Average airfare: 10% weight—Calculated using a weighted average of domestic airfares (round-trip or one-way for which no return is purchased) for all airports within a 50-mile radius of each market, weighted by airport annual domestic passenger volume. The top 432 airports by domestic passenger volume were used.
- Concentration of arts, entertainment & recreation: 10% weight — calculated using the total number of business establishments in arts, entertainment, and recreation (NAICS industry code 71) per 10,000 residents using the latest CBP data.
- Concentration of restaurants & bars: 10% weight — calculated using the total number of restaurant and bar business establishments (NAICS industry code 722) per 10,000 residents using the latest CBP data.
- Concentration of hotels: 10% weight — calculated using the total number of hotel business establishments (NAICS industry code 7211) per 10,000 residents using the latest CBP data.
Additionally, an affordability score was formulated using the average nightly hotel rate, average daily meals and incidentals, cost of services compared to average, and average airfare all weighted equally.
The entertainment score was created by equally weighting the concentration of arts, entertainment and recreation, concentration of restaurants and bars, and concentration of hotels.
To ensure relevance, the analysis was limited to metropolitan and micropolitan areas with an average winter high temperature of 60 degrees Fahrenheit or higher, and only locations with complete data were considered for the analysis.

Add a Comment