


Editor's Note: This story originally appeared on Self.
The one-dollar bill is one of the world’s most powerful pieces of paper.
In 2021, due to the pandemic, inflation hit a 30-year high, highlighting the changing power of the dollar for most folks. And while a single buck isn’t going to buy you your first home or a brand new set of wheels, it is crucial for your weekly groceries or gassing up those wheels.
We wanted to know how the power of the dollar has changed over time so we analyzed historic pricing and cost-of-living data to show you what your $1 would get you at the grocery store in 2021, compared with every decade going back to 1900.
The Value of $1 in 1900-1910 versus 2021

Overall, across the goods we analyzed, we found that one dollar purchased approximately 94% less in 2021 compared with 1900-1910.
Below is a breakdown of what one dollar could purchase in 1900-1910 compared with the 2020s.
| Item | | Amount per dollar (1900-1910) | | Amount per dollar (2020s) | | Change (%) |
|---|---|---|---|
| Chocolate | 1.25 lbs. | 0.1 lb. | -92% |
| Coffee | 3 lbs. | 0.18 lb. | -94% |
| Butter | 4 lbs. | 0.26 lb. | -93.50% |
| Lemons | 80 lemons | 1.8 lemons | -97.75% |
| Toilet paper | 12 rolls | 1.2 rolls | -90% |
| Soap | 20 bars | 0.78 bar | -96.10% |
| Gasoline | 14.3 gallons | 0.3 gallon | -97.90% |
| Rice | 14.2 lbs. | 1.4 lbs. | -90.10% |
| Bread | 14.2 loaves | 0.5 loaf | -96.50% |
| Milk | 3.6 gallons | 0.3 gallon | -91.70% |
While our data goes back to 1900, it’s considered that the power of the dollar was actually at its peak in the 1910s after the creation of the Federal Reserve System in 1913, which was designed to alleviate the damage caused by financial crises, primarily brought on by the financial panic of 1907.
You can see the power of the 1910s dollar (1910-1920) in some grocery items in our analysis. For example, chocolate peaked in the decade at 2.1lbs./$1 as did lemons at 125 lemons/$1.
However, some other items were at their most cost-effective in the 1920s during this period of financial security and before the financial crash in 1929. For example, a 1920s American could buy the most coffee (3.7 lbs./$1) and toilet paper (30 rolls/$1) for a dollar in this decade than any other.
Following is a breakdown of each item over time and how much one dollar would be able to purchase in periods from the 1900s to today.
Chocolate

Between 1900-1910, $1 would get you an average of 1.25 lbs. of chocolate, this peaked higher at 2.1 lbs. in the next decade only to come crashing back down to 1.25 lbs. in the 1920s.
Since the 2000s began, you can expect to get an average of 0.1 lb. (1.6 oz.) of chocolate for $1, and this is still true today.

Coffee
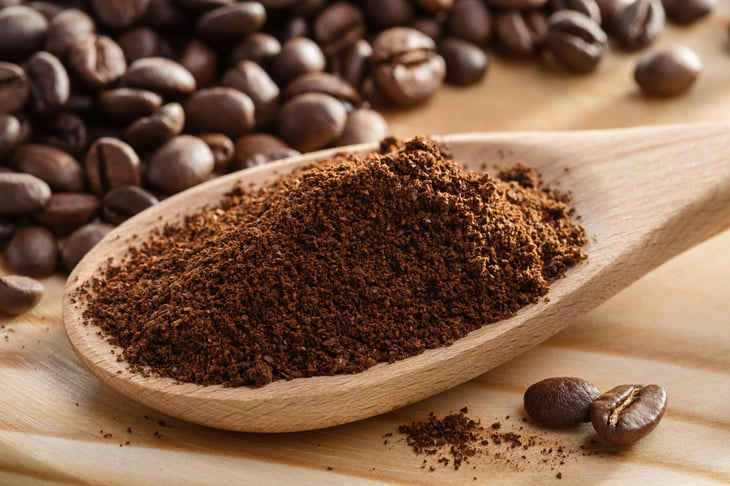
The average coffee lover drinks over 3 cups a day! How far can a dollar get you toward your caffeine fix now? To analyze this we looked at historic prices of coffee grounds over time.
The most coffee you could get for your money was in the 1940s, at 4.1 lbs./$1, and now you can get an average of just 0.17 lb. for $1.
Butter

Essential for your morning toast or home-baked goods, butter is a staple in our grocery shopping — but how many blocks could you get with one dollar over time?
Between 1900-1910 you could get an average of 4 lbs. butter per dollar, and it has decreased fairly consistently each decade since, although there was a slight rise in the 1930s, where $1 could buy 2.7 lbs. of butter — that’s enough for over three carrot cake recipes!
The purchasing power of the dollar did increase in the 1930s due to the stock market crash in 1929, so such fluctuations could be expected.
Lemons

It’s highly unlikely you would have spent a dollar on lemons in the 1910s because that single buck would’ve bought you around 125 individual lemons. This is up from 80 lemons in the decade before.
Toilet paper

Today, a dollar will buy you an average of 1.2 toilet paper rolls. It’s nowhere near the pyramid of 30 rolls you could have purchased for a buck in the 1920s.
Importantly, even if we analyzed the sheet count of toilet paper over time, we have no reliable way of understanding the change in sheet size over time.
Toilet paper sheets have shrunk from around 4.5 inches to 4 inches in the last decade, and this probably happened many other times since the 1900s. Ultimately, this means the dollar has bought many fewer wipes and cleanups as well as fewer sheets over time.
Soap

If you wanted to stay clean back in the 1900s, $1 would get you 20 soap bars — that’s enough for one person for about two years’ worth of regular cleaning!
Interestingly, when looking at the price of soap bars over time, we can see that $1 would have got you around 12 bars in both the 1910s and 1950s. It’s possible that the nation’s two world wars and the 1929 stock market crash impacted this, but it is hard to say for certain.
Gasoline

In the 1900s, you could get an average of 14.3 gallons of gas for $1. Fast forward to the 2020s, and you can expect to pump just around 0.3 gallon per dollar. This is of course a nationwide average and would vary greatly in each state.
Rice

Between 1900-1910, you could buy an average of 14.2 lbs. of rice for one dollar; that’s over 10 times more than a buck will get you now (1.4 lbs./$1). Despite this, using an inflation calculator, we can see that $1 in 1900 would be worth around $33 in 2021.
In the 1910s, ’30s, and ’40s, you could consistently buy over 11 lbs. of rice with $1, except for the 1920s when historic grocery ads indicate you could only buy around 5.8 lbs. for the same price.
Bread
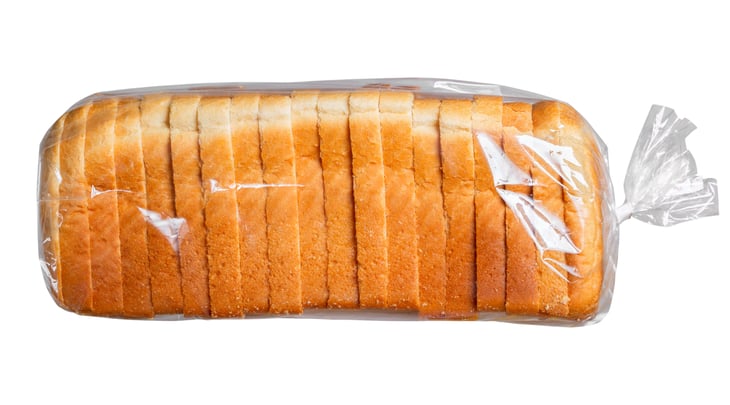
Most people are unlikely to need more than one or two loaves of bread, but in the 1900s and 1910s, you could buy over 14 with $1 if you wanted.
Since the 2010s, a dollar can buy an average of half a loaf of bread, up from an eighth of a loaf in the 2000s.
Milk
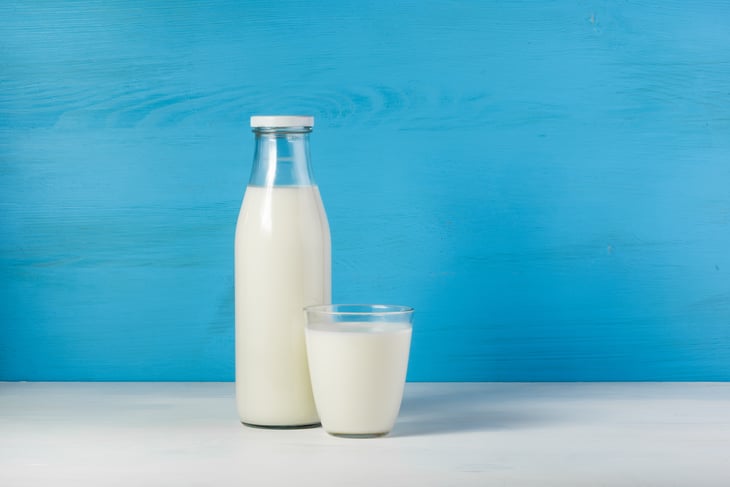
From 1900 until the 1930s, $1 could buy 3.6 gallons of milk consistently, and then you could get even more (3.8 gallons) in the ’30s for the same amount.
After that, $1 would buy less milk each decade as the cost of living increased, leading to around 0.3 gallon from the 2000s onwards.
Methodology

We took historic food and gasoline prices from a range of sources to plot the average price per decade per item focusing solely on how much one dollar could buy of that item.
Where possible average retail prices were used, however, the prices were dictated by what historical data exists. Where there was enough data across multiple years, we took a mean average price for the decade for the products analyzed. For some decades, data was only available for one year.
The 2021 prices were taken from Walmart’s online grocery prices on Oct. 1, 2021. Average costs were taken from the 10 most popular products in that category based on the “Best selling” filter functionality.
Data shows how much of a product you could have bought for $1 in that decade. Products like bread for example, were analyzed as if you could buy portions of a loaf to show exactly what $1 could purchase.
Also it should be noted that the data does not, and cannot, account for a societal shift in the size of non-weighted products like soap bars, which are simply priced per bar and not in ounces.
Add a Comment
Our Policy: We welcome relevant and respectful comments in order to foster healthy and informative discussions. All other comments may be removed. Comments with links are automatically held for moderation.