


Editor's Note: This story originally appeared on HireAHelper.
Inflation in the U.S. is starting to show signs of cooling after reaching historic heights over the last year and a half. This is good news for almost every U.S. household, but especially for the more than 55 million Americans at retirement age or older.
The Social Security Administration recently announced that the program’s beneficiaries will receive an 8.7% cost of living adjustment in 2023. The increase in benefit payouts comes after a 5.9% cost of living adjustment in 2022, which was the highest since the 1980s.
But despite these aggressive increases, critics have argued the adjustments are insufficient given the pace of inflation and the high number of retirees who rely entirely, or almost entirely, on their Social Security benefits.
The rising cost of living and reliance on fixed income threatens to push higher shares of elderly Americans into poverty. Essential categories like food and housing have seen the highest rates of inflation since 2021, which can quickly eat into household budgets.
Elderly people are also more likely to face medical issues that could add to their expenses. As a result of these factors, 11.5% of Americans age 75 and over have incomes below the U.S. poverty level, the second-highest of any age cohort.
The data used in this analysis is from the U.S. Census Bureau, U.S. Bureau of Economic Analysis and Zillow. Using that data, here are the most popular affordable U.S. metropolitan areas for retirees.
15. Cincinnati, OH-KY-IN
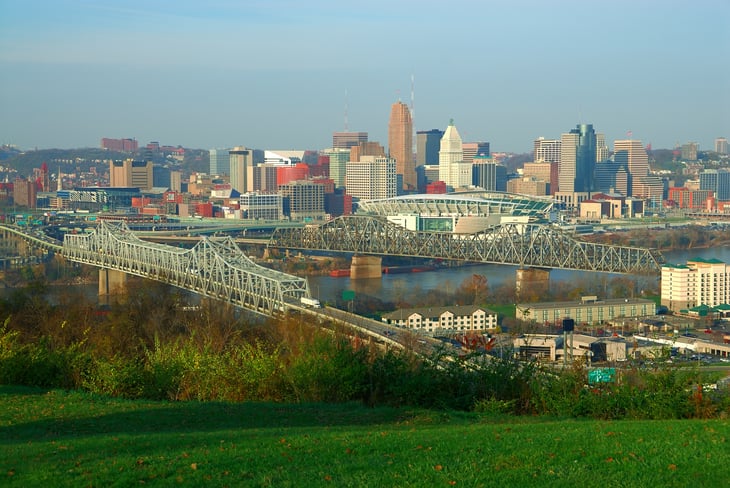
- Percentage of the population 65 and over: 15.9%
- Total population 65 and over: 360,394
- Cost of living (compared to average): -6.5%
- Median home price: $264,110
14. Tulsa, OK

- Percentage of the population 65 and over: 16.1%
- Total population 65 and over: 164,435
- Cost of living (compared to average): -7.1%
- Median home price: $217,054
13. Milwaukee-Waukesha, WI
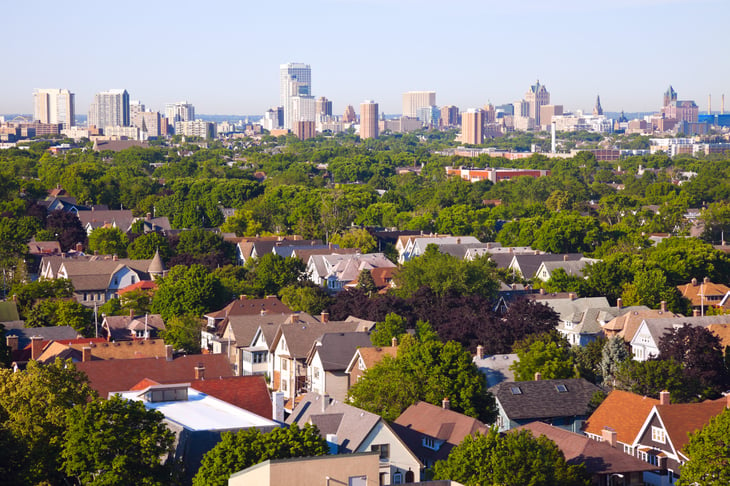
- Percentage of the population 65 and over: 16.5%
- Total population 65 and over: 258,407
- Cost of living (compared to average): -4.1%
- Median home price: $268,653
12. Richmond, VA

- Percentage of the population 65 and over: 16.6%
- Total population 65 and over: 219,271
- Cost of living (compared to average): -4.6%
- Median home price: $342,146
11. Birmingham-Hoover, AL

- Percentage of the population 65 and over: 16.7%
- Total population 65 and over: 186,612
- Cost of living (compared to average): -7.4%
- Median home price: $249,754
10. Jacksonville, FL

- Percentage of the population 65 and over: 16.8%
- Total population 65 and over: 274,814
- Cost of living (compared to average): -3.7%
- Median home price: $379,425

9. New Orleans-Metairie, LA

- Percentage of the population 65 and over: 17.3%
- Total population 65 and over: 218,184
- Cost of living (compared to average): -3.1%
- Median home price: $271,024
8. Detroit-Warren-Dearborn, MI

- Percentage of the population 65 and over: 17.3%
- Total population 65 and over: 756,935
- Cost of living (compared to average): -2.9%
- Median home price: $239,519
7. St. Louis, MO-IL

- Percentage of the population 65 and over: 17.6%
- Total population 65 and over: 492,646
- Cost of living (compared to average): -4.3%
- Median home price: $243,975
6. Rochester, NY

- Percentage of the population 65 and over: 19.0%
- Total population 65 and over: 206,622
- Cost of living (compared to average): -1.7%
- Median home price: $218,418
5. Buffalo-Cheektowaga, NY
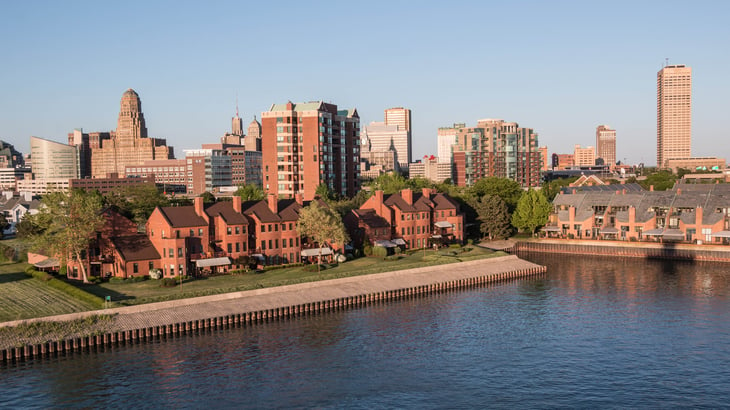
- Percentage of the population 65 and over: 19.1%
- Total population 65 and over: 221,893
- Cost of living (compared to average): -4.3%
- Median home price: $246,218
4. Cleveland-Elyria, OH

- Percentage of the population 65 and over: 19.4%
- Total population 65 and over: 402,285
- Cost of living (compared to average): -7.0%
- Median home price: $219,942
3. Tampa-St. Petersburg-Clearwater, FL

- Percentage of the population 65 and over: 20.2%
- Total population 65 and over: 649,159
- Cost of living (compared to average): -0.9%
- Median home price: $390,811
2. Tucson, AZ

- Percentage of the population 65 and over: 20.7%
- Total population 65 and over: 217,439
- Cost of living (compared to average): -6.2%
- Median home price: $344,547
1. Pittsburgh, PA

- Percentage of the population 65 and over: 20.8%
- Total population 65 and over: 490,296
- Cost of living (compared to average): -4.3%
- Median home price: $209,887
Methodology
The data used in this analysis is from the U.S. Census Bureau’s 2021 American Community Survey, the U.S. Bureau of Economic Analysis’ Regional Price Parities, and Zillow’s Housing Data. To determine the most popular affordable locations for retirees, researchers at HireAHelper calculated the percentage of the population age 65 and over. In the event of a tie, the location with the greater total population age 65 and over was ranked higher. To improve relevance, only metropolitan areas with at least 100,000 residents were included. Additionally, metros were grouped into cohorts based on population size: small (100,000–349,999), midsize (350,000–999,999), and large (1,000,000 or more). Note, only locations with a cost of living below the national average were considered in this analysis.
Add a Comment
Our Policy: We welcome relevant and respectful comments in order to foster healthy and informative discussions. All other comments may be removed. Comments with links are automatically held for moderation.