


Editor's Note: This story originally appeared on Construction Coverage.
Labor unions in the United States have faced major challenges over the last several decades. Anti-union initiatives by employers, the growing prominence of the gig economy, and shifting labor laws, among other factors, all contributed to a steady decline in union membership.
But recently, interest in unionization has resurfaced. The narrowly averted UPS strike and notable strikes by writers and actors in Hollywood have garnered major interest and made headlines nationwide.
Union workers not only have more protection from unemployment, they also enjoy wage premiums over non-union workers. Although union members on average earn more than their non-union worker counterparts, union membership in the U.S. has declined significantly over the past several decades.
Despite declining union membership rates nationally, differences in local economies, politics, and legislation can impact union membership rates at the state level.
To determine the most unionized locations in America, researchers at Construction Coverage analyzed data from UnionStats.com and the U.S. Bureau of Labor Statistics, ranking metropolitan areas according to the share of total employment that are union members. See the methodology at the end.
Here are the most unionized U.S. metropolitan areas.
15. Los Angeles-Long Beach-Anaheim, CA
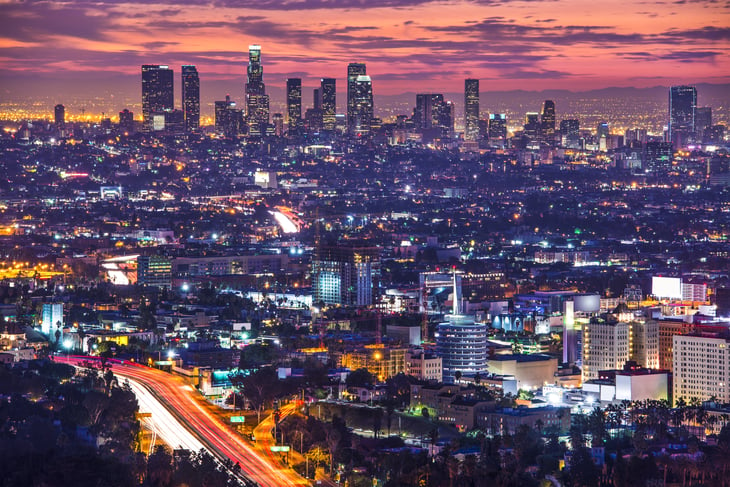
- Union membership rate: 13.6%
- Union representation rate: 14.7%
- Workers who are members of unions: 736,464
- Workers who are represented by unions: 792,202
- Total employment: 5,399,876
14. Minneapolis-St. Paul-Bloomington, MN-WI

- Union membership rate: 13.7%
- Union representation rate: 14.6%
- Workers who are members of unions: 270,873
- Workers who are represented by unions: 288,625
- Total employment: 1,982,212
13. San Francisco-Oakland-Berkeley, CA

- Union membership rate: 13.7%
- Union representation rate: 14.3%
- Workers who are members of unions: 295,446
- Workers who are represented by unions: 307,971
- Total employment: 2,158,220

12. Fresno, CA

- Union membership rate: 14.2%
- Union representation rate: 17.4%
- Workers who are members of unions: 49,396
- Workers who are represented by unions: 60,762
- Total employment: 348,751
11. Philadelphia-Camden-Wilmington, PA-NJ-DE-MD

- Union membership rate: 14.4%
- Union representation rate: 15.5%
- Workers who are members of unions: 406,200
- Workers who are represented by unions: 436,670
- Total employment: 2,815,535
10. Hartford-East Hartford-Middletown, CT

- Union membership rate: 14.5%
- Union representation rate: 16.0%
- Workers who are members of unions: 81,747
- Workers who are represented by unions: 90,086
- Total employment: 562,300
9. San Diego-Chula Vista-Carlsbad, CA
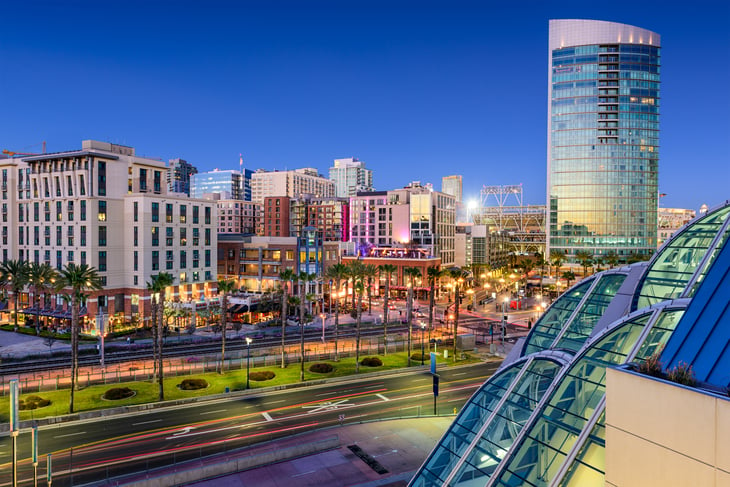
- Union membership rate: 15.6%
- Union representation rate: 17.6%
- Workers who are members of unions: 218,491
- Workers who are represented by unions: 247,531
- Total employment: 1,402,461
8. Portland-Vancouver-Hillsboro, OR-WA
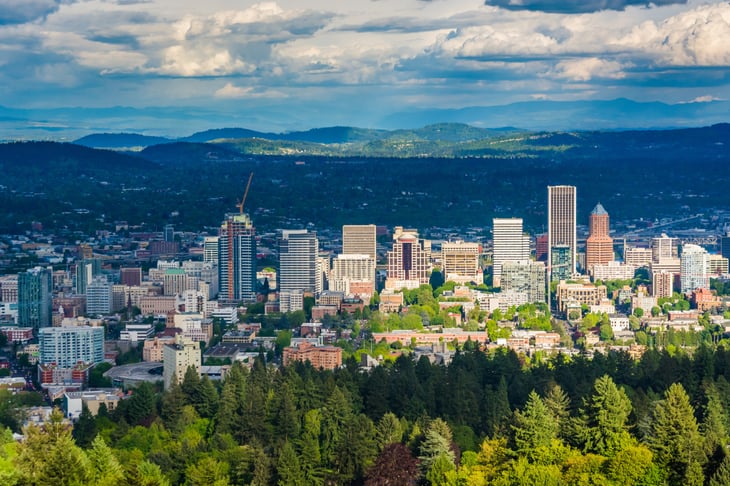
- Union membership rate: 15.8%
- Union representation rate: 16.8%
- Workers who are members of unions: 180,926
- Workers who are represented by unions: 193,133
- Total employment: 1,147,550
7. Detroit-Warren-Dearborn, MI
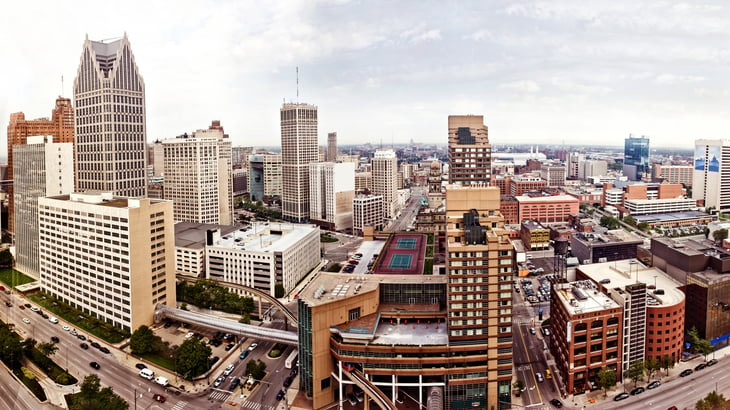
- Union membership rate: 15.8%
- Union representation rate: 16.8%
- Workers who are members of unions: 306,407
- Workers who are represented by unions: 327,113
- Total employment: 1,943,364
6. Providence-Warwick, RI-MA
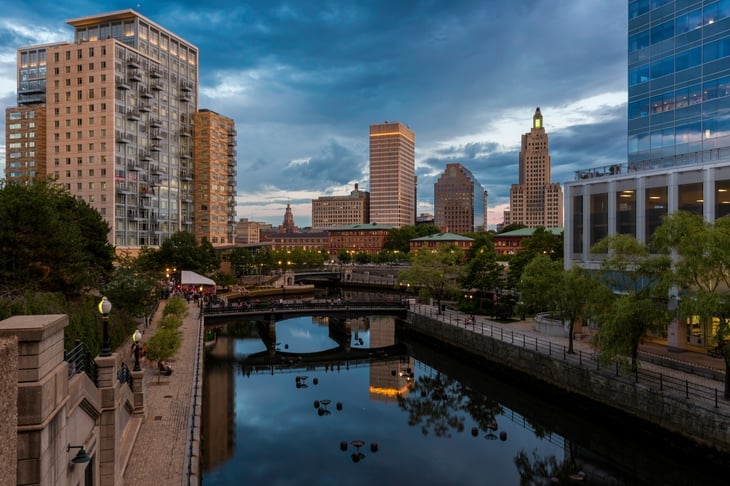
- Union membership rate: 16.2%
- Union representation rate: 18.0%
- Workers who are members of unions: 122,477
- Workers who are represented by unions: 136,074
- Total employment: 755,483
5. Seattle-Tacoma-Bellevue, WA
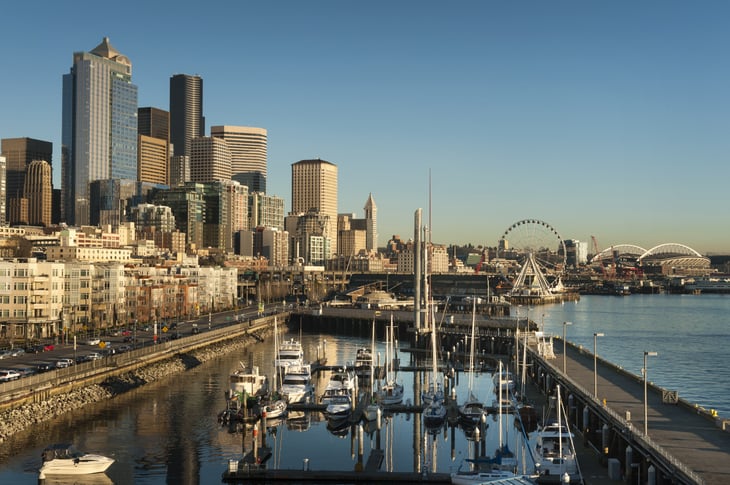
- Union membership rate: 16.6%
- Union representation rate: 18.0%
- Workers who are members of unions: 325,707
- Workers who are represented by unions: 352,346
- Total employment: 1,960,848
4. Riverside-San Bernardino-Ontario, CA
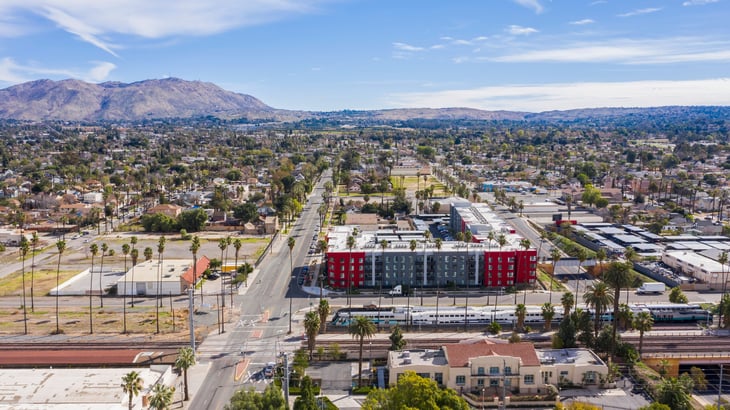
- Union membership rate: 17.8%
- Union representation rate: 22.2%
- Workers who are members of unions: 329,984
- Workers who are represented by unions: 411,934
- Total employment: 1,855,064
3. New York-Newark-Jersey City, NY-NJ-PA

- Union membership rate: 18.1%
- Union representation rate: 19.5%
- Workers who are members of unions: 1,606,871
- Workers who are represented by unions: 1,722,399
- Total employment: 8,854,530
2. Sacramento-Roseville-Folsom, CA
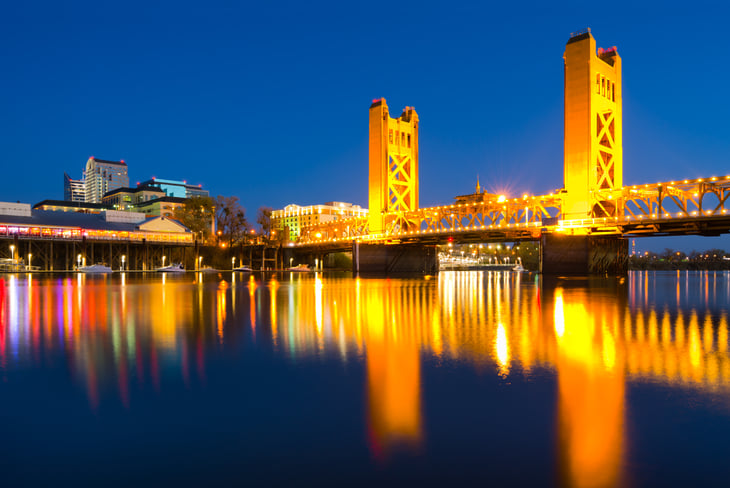
- Union membership rate: 19.7%
- Union representation rate: 21.8%
- Workers who are members of unions: 190,653
- Workers who are represented by unions: 211,139
- Total employment: 968,122
1. Buffalo-Cheektowaga, NY
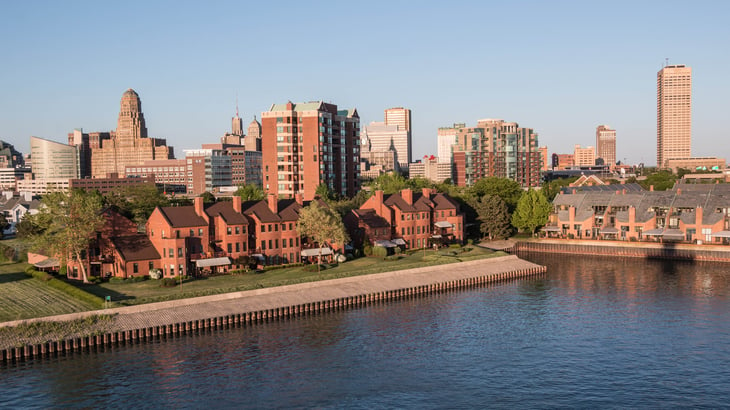
- Union membership rate: 23.5%
- Union representation rate: 25.8%
- Workers who are members of unions: 108,420
- Workers who are represented by unions: 119,015
- Total employment: 460,560
Methodology

To determine the most unionized metros in America, researchers at Construction Coverage analyzed data from “UnionStats.com” and the U.S. Census Bureau’s “Population and Housing Estimates.”
The researchers ranked metropolitan areas according to total union members as a percentage of total employment.
In addition to union membership, the researchers also included statistics on union representation, which is the share of workers whose terms of work are negotiated collectively (whether or not they are union members).
Only metropolitan areas with available data and with at least 100,000 residents were included in the analysis.
Add a Comment
Our Policy: We welcome relevant and respectful comments in order to foster healthy and informative discussions. All other comments may be removed. Comments with links are automatically held for moderation.