


Editor's Note: This story originally appeared on Upgraded Points.
After the post-pandemic travel boom saw international departures soar in 2023, the landscape has shifted.
In 2025, the era of “revenge travel” has given way to a more moderate demand for international trips, with growth normalizing as economic uncertainty comes into play. While the winter holiday season remains a peak period for U.S. travelers heading abroad, the overall volume is no longer on the explosive upward trajectory seen in previous years.
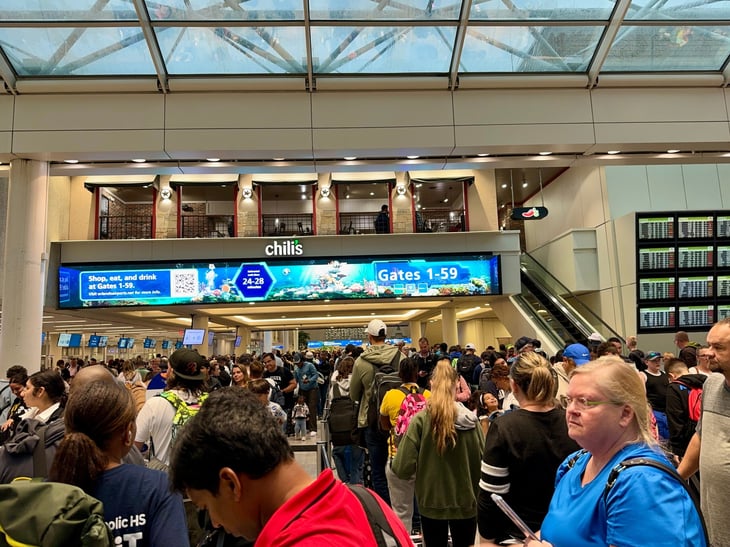
One might assume that a leveling off in demand would automatically lead to shorter lines at airport security and customs. However, the reality is more complex.
As passenger forecasts adjust, both airports and U.S. Customs and Border Protection (CBP) may recalibrate staffing. This can create a delicate balance in which even a modest holiday surge can outpace available resources, leading to unexpected bottlenecks.
Fortunately, even in this evolving travel climate, many factors within the traveler’s control — including choice of airport and arrival time — can increase the likelihood of an efficient travel day this holiday season.
To find the airports with the most trouble over the holidays, Upgraded Points researchers conducted an analysis using U.S. Customs and Border Protection data. Learn more about the methodology at the end.
Here are the worst U.S. airports for international travel during the winter holiday season.
15. San Francisco International Airport
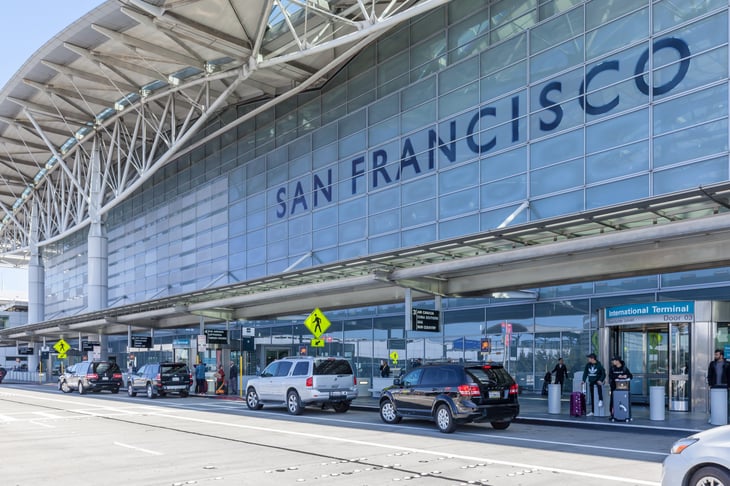
- Airport Code: SFO
- Primary City: San Francisco, CA
- Average Wait Time for All Travelers (Minutes): 20.7
- Average Max Wait Time for All Travelers (Minutes): 51.7
- Average Wait Time for U.S. Citizens (Minutes): 15.7
- Average Wait Time for Non-U.S. Citizens (Minutes): 27.2
- Share of All Travelers That Wait Less Than 15 Minutes: 45.1%
- Share of All Travelers That Wait Greater Than 60 Minutes: 3.7%
14. Ontario International Airport

- Airport Code: ONT
- Primary City: Ontario, CA
- Average Wait Time for All Travelers (Minutes): 21.0
- Average Max Wait Time for All Travelers (Minutes): 39.6
- Average Wait Time for U.S. Citizens (Minutes): 19.2
- Average Wait Time for Non-U.S. Citizens (Minutes): 23.9
- Share of All Travelers That Wait Less Than 15 Minutes: 33.8%
- Share of All Travelers That Wait Greater Than 60 Minutes: 0.3%
13. Seattle-Tacoma International Airport

- Airport Code: SEA
- Primary City: Seattle, WA
- Average Wait Time for All Travelers (Minutes): 21.4
- Average Max Wait Time for All Travelers (Minutes): 56.1
- Average Wait Time for U.S. Citizens (Minutes): 18.3
- Average Wait Time for Non-U.S. Citizens (Minutes): 26.3
- Share of All Travelers That Wait Less Than 15 Minutes: 40.2%
- Share of All Travelers That Wait Greater Than 60 Minutes: 3.2%
12. Minneapolis-Saint Paul International Airport
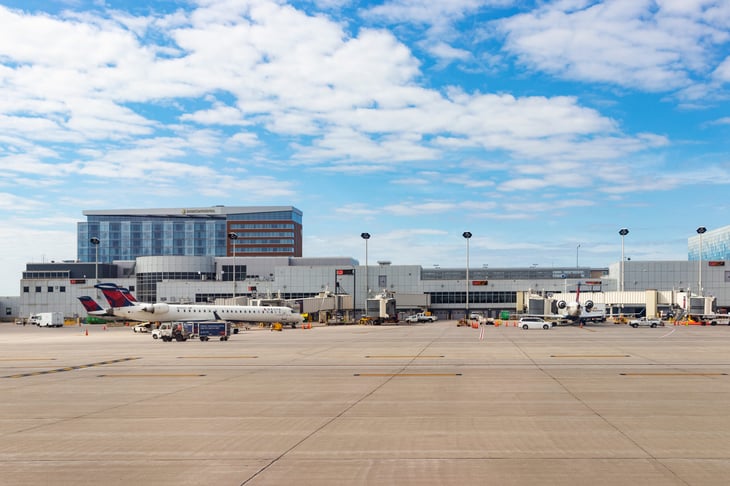
- Airport Code: MSP
- Primary City: Minneapolis, MN
- Average Wait Time for All Travelers (Minutes): 22.8
- Average Max Wait Time for All Travelers (Minutes): 52.6
- Average Wait Time for U.S. Citizens (Minutes): 20.6
- Average Wait Time for Non-U.S. Citizens (Minutes): 33.5
- Share of All Travelers That Wait Less Than 15 Minutes: 44.3%
- Share of All Travelers That Wait Greater Than 60 Minutes: 5.8%
11. Newark Liberty International Airport

- Airport Code: EWR
- Primary City: Newark, NJ
- Average Wait Time for All Travelers (Minutes): 22.9
- Average Max Wait Time for All Travelers (Minutes): 59.0
- Average Wait Time for U.S. Citizens (Minutes): 14.1
- Average Wait Time for Non-U.S. Citizens (Minutes): 33.4
- Share of All Travelers That Wait Less Than 15 Minutes: 45.5%
- Share of All Travelers That Wait Greater Than 60 Minutes: 7.2%
10. George Bush Intercontinental Airport

- Airport Code: IAH
- Primary City: Houston, TX
- Average Wait Time for All Travelers (Minutes): 23.0
- Average Max Wait Time for All Travelers (Minutes): 62.1
- Average Wait Time for U.S. Citizens (Minutes): 17.7
- Average Wait Time for Non-U.S. Citizens (Minutes): 29.1
- Share of All Travelers That Wait Less Than 15 Minutes: 41.6%
- Share of All Travelers That Wait Greater Than 60 Minutes: 5.2%
9. San Diego International Airport
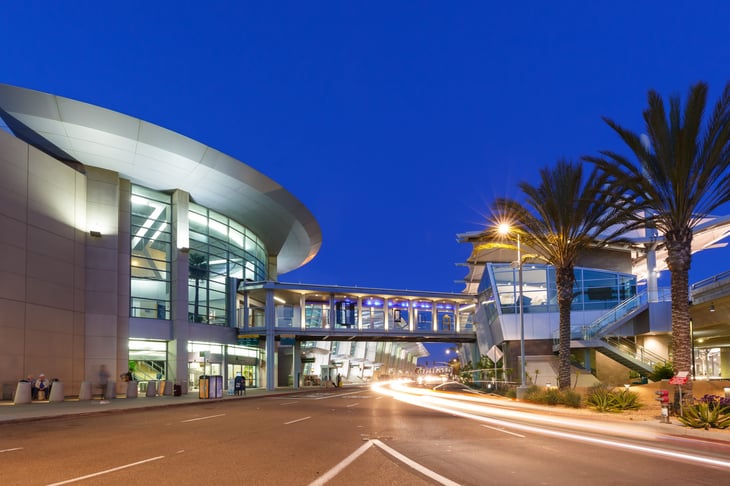
- Airport Code: SAN
- Primary City: San Diego, CA
- Average Wait Time for All Travelers (Minutes): 23.4
- Average Max Wait Time for All Travelers (Minutes): 43.6
- Average Wait Time for U.S. Citizens (Minutes): 20.9
- Average Wait Time for Non-U.S. Citizens (Minutes): 29.3
- Share of All Travelers That Wait Less Than 15 Minutes: 31.0%
- Share of All Travelers That Wait Greater Than 60 Minutes: 1.3%
8. Miami International Airport
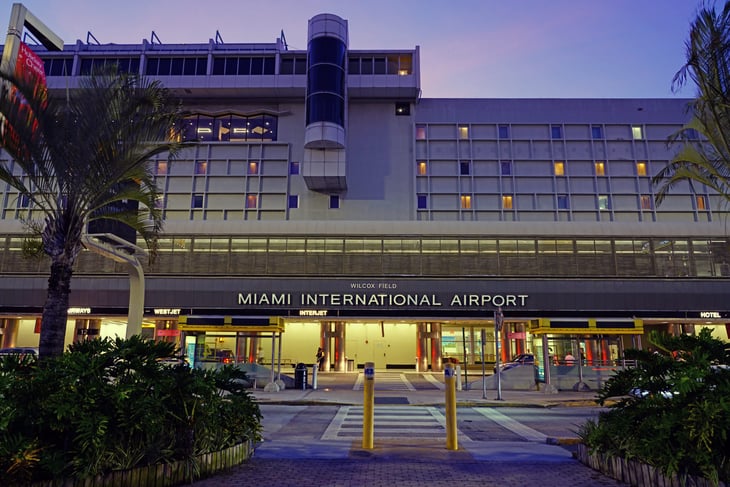
- Airport Code: MIA
- Primary City: Miami, FL
- Average Wait Time for All Travelers (Minutes): 23.9
- Average Max Wait Time for All Travelers (Minutes): 67.3
- Average Wait Time for U.S. Citizens (Minutes): 14.3
- Average Wait Time for Non-U.S. Citizens (Minutes): 30.1
- Share of All Travelers That Wait Less Than 15 Minutes: 41.2%
- Share of All Travelers That Wait Greater Than 60 Minutes: 7.6%
7. John F. Kennedy International Airport
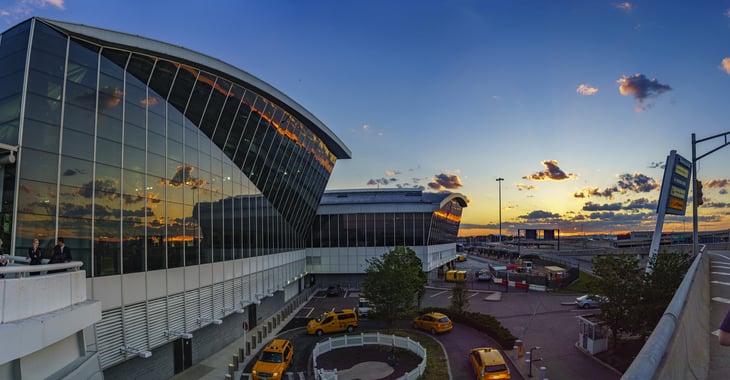
- Airport Code: JFK
- Primary City: New York, NY
- Average Wait Time for All Travelers (Minutes): 26.1
- Average Max Wait Time for All Travelers (Minutes): 63.7
- Average Wait Time for U.S. Citizens (Minutes): 14.6
- Average Wait Time for Non-U.S. Citizens (Minutes): 35.2
- Share of All Travelers That Wait Less Than 15 Minutes: 39.7%
- Share of All Travelers That Wait Greater Than 60 Minutes: 8.5%
6. Fort Lauderdale-Hollywood International Airport
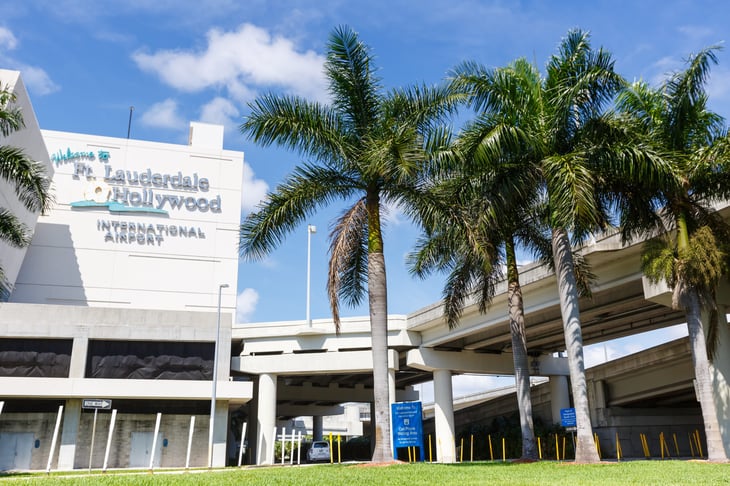
- Airport Code: FLL
- Primary City: Fort Lauderdale, FL
- Average Wait Time for All Travelers (Minutes): 26.3
- Average Max Wait Time for All Travelers (Minutes): 67.1
- Average Wait Time for U.S. Citizens (Minutes): 19.4
- Average Wait Time for Non-U.S. Citizens (Minutes): 31.7
- Share of All Travelers That Wait Less Than 15 Minutes: 39.5%
- Share of All Travelers That Wait Greater Than 60 Minutes: 9.6%
5. Austin-Bergstrom International Airport

- Airport Code: AUS
- Primary City: Austin, TX
- Average Wait Time for All Travelers (Minutes): 26.9
- Average Max Wait Time for All Travelers (Minutes): 58.4
- Average Wait Time for U.S. Citizens (Minutes): 23.2
- Average Wait Time for Non-U.S. Citizens (Minutes): 34.9
- Share of All Travelers That Wait Less Than 15 Minutes: 33.5%
- Share of All Travelers That Wait Greater Than 60 Minutes: 5.4%
4. Chicago O’Hare International Airport
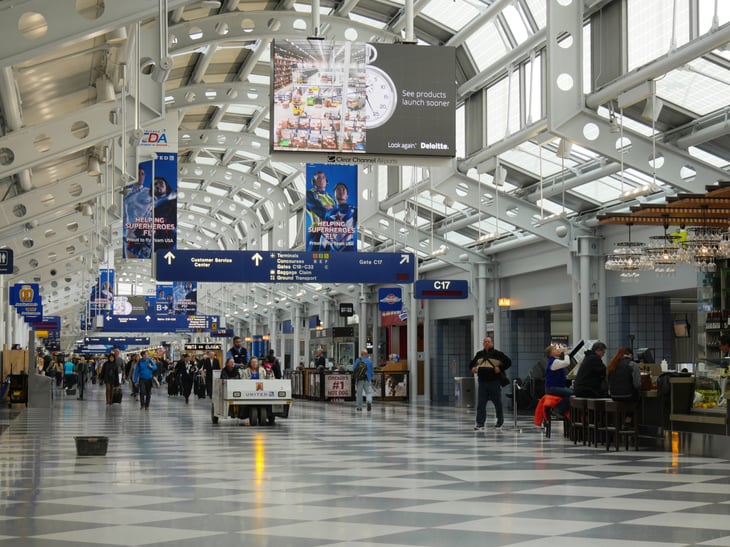
- Airport Code: ORD
- Primary City: Chicago, IL
- Average Wait Time for All Travelers (Minutes): 27.3
- Average Max Wait Time for All Travelers (Minutes): 68.4
- Average Wait Time for U.S. Citizens (Minutes): 22.7
- Average Wait Time for Non-U.S. Citizens (Minutes): 35.2
- Share of All Travelers That Wait Less Than 15 Minutes: 35.6%
- Share of All Travelers That Wait Greater Than 60 Minutes: 9.1%
3. Nashville International Airport
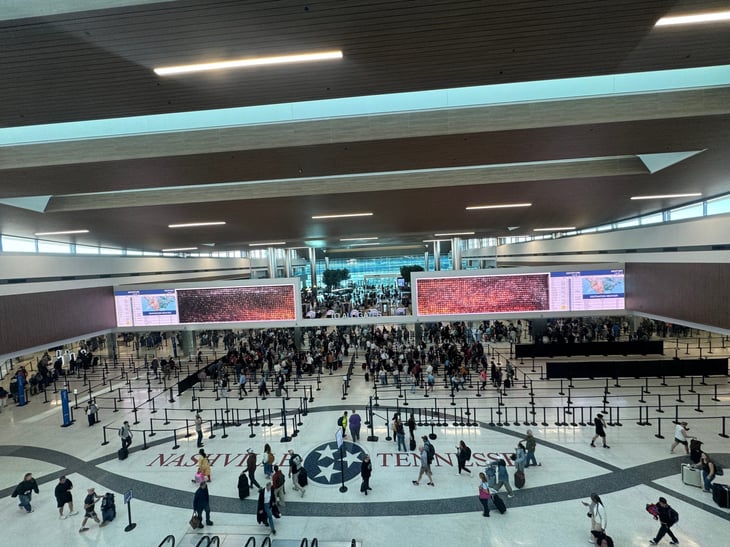
- Airport Code: BNA
- Primary City: Nashville, TN
- Average Wait Time for All Travelers (Minutes): 27.9
- Average Max Wait Time for All Travelers (Minutes): 52.1
- Average Wait Time for U.S. Citizens (Minutes): 26.0
- Average Wait Time for Non-U.S. Citizens (Minutes): 33.5
- Share of All Travelers That Wait Less Than 15 Minutes: 24.1%
- Share of All Travelers That Wait Greater Than 60 Minutes: 4.2%
2. Los Angeles International Airport

- Airport Code: LAX
- Primary City: Los Angeles, CA
- Average Wait Time for All Travelers (Minutes): 30.3
- Average Max Wait Time for All Travelers (Minutes): 75.5
- Average Wait Time for U.S. Citizens (Minutes): 20.1
- Average Wait Time for Non-U.S. Citizens (Minutes): 41.4
- Share of All Travelers That Wait Less Than 15 Minutes: 29.5%
- Share of All Travelers That Wait Greater Than 60 Minutes: 11.5%
1. Orlando International Airport
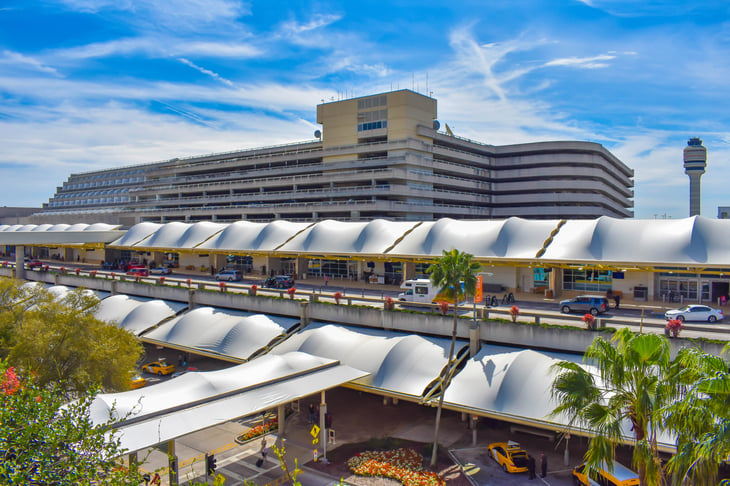
- Airport Code: MCO
- Primary City: Orlando, FL
- Average Wait Time for All Travelers (Minutes): 32.7
- Average Max Wait Time for All Travelers (Minutes): 66.9
- Average Wait Time for U.S. Citizens (Minutes): 23.1
- Average Wait Time for Non-U.S. Citizens (Minutes): 37.4
- Share of All Travelers That Wait Less Than 15 Minutes: 26.1%
- Share of All Travelers That Wait Greater Than 60 Minutes: 12.6%
Methodology

The data used in this study is from the U.S. Customs and Border Protection’s CBP Airport Wait Times dataset.
To determine the worst airports for international travel this winter holiday season, researchers at Upgraded Points calculated average wait times for travelers passing through customs during the 2024 winter holiday travel season (including the week before Christmas through the New Year holiday).
All major U.S. international airports tracked by the CBP were included. Researchers also calculated the average maximum wait time for all travelers, which is a total traveler-weighted average of the hourly maximum wait times reported for each airport over the study period.
Average holiday wait times for U.S. citizens and non-U.S. citizens, the percentage of all travelers that passed through customs in under 15 minutes, and the percentage of all travelers that passed through customs in greater than 60 minutes during the same time period were also included.

Add a Comment