


Editor's Note: This story originally appeared on Construction Coverage.
Rising real estate prices and interest rate hikes have finally started to bring balance back to the residential market this year. But while demand is falling off, the U.S. still has a major need for new homes, which could create plenty of opportunity for residential builders.
One of the major factors that contributed to the heightened competition for housing over the last two years was the housing supply. The U.S. suffered from a severe shortage of housing stock before COVID-19, and the pandemic sent available inventory to record lows. With a rush of buyers in the market, the limited availability of homes stoked competition and pushed prices higher.
Builders have rushed to meet the need for new units. Housing permits and starts bounced back strongly after falling sharply early in the COVID-19 pandemic. And despite a recent downtick, housing starts have been higher this year than at any other point since before the Great Recession.
To determine the locations where the most expensive homes are being built in the U.S., researchers at Construction Coverage calculated the average permit value per unit authorized through building permit data. Authorized units included both single-unit and multiple-unit structures. The data used in this analysis is from the U.S. Census Bureau’s Building Permits Survey (2021), the most recent data available. Read more on our methodology at the end.
Here are the counties where the most expensive homes are being built.
15. Pima, AZ

- Average value per unit authorized: $279,120
- Total value of units authorized: $1,753,991,844
- Total units authorized: 6,284
- Single-family units as a proportion of total: 81.4%
14. San Joaquin, CA

- Average value per unit authorized: $291,070
- Total value of units authorized: $1,277,507,042
- Total units authorized: 4,389
- Single-family units as a proportion of total: 84.7%
13. Erie, NY
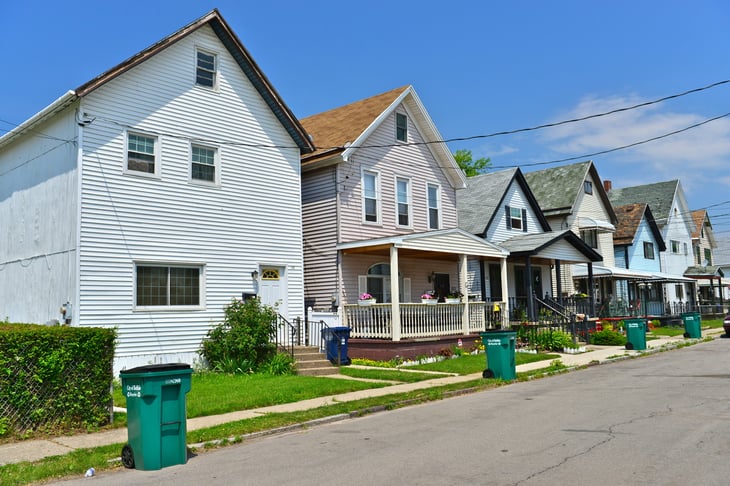
- Average value per unit authorized: $306,682
- Total value of units authorized: $413,407,110
- Total units authorized: 1,348
- Single-family units as a proportion of total: 59.5%
12. Macomb, MI
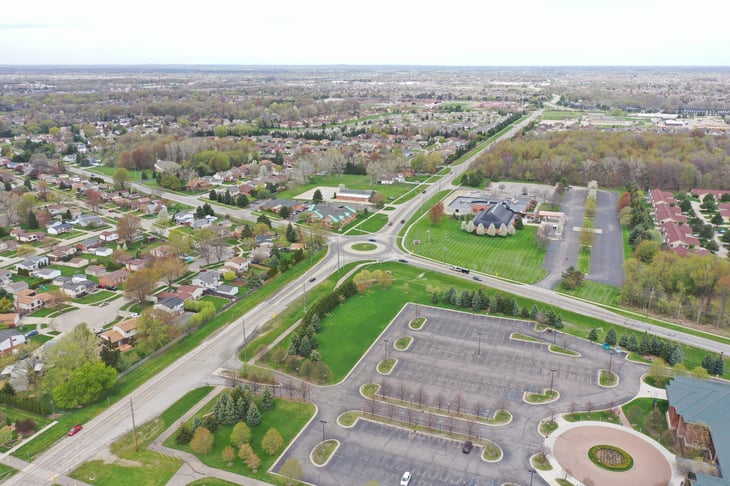
- Average value per unit authorized: $307,076
- Total value of units authorized: $530,321,027
- Total units authorized: 1,727
- Single-family units as a proportion of total: 72.8%
11. Nassau, NY
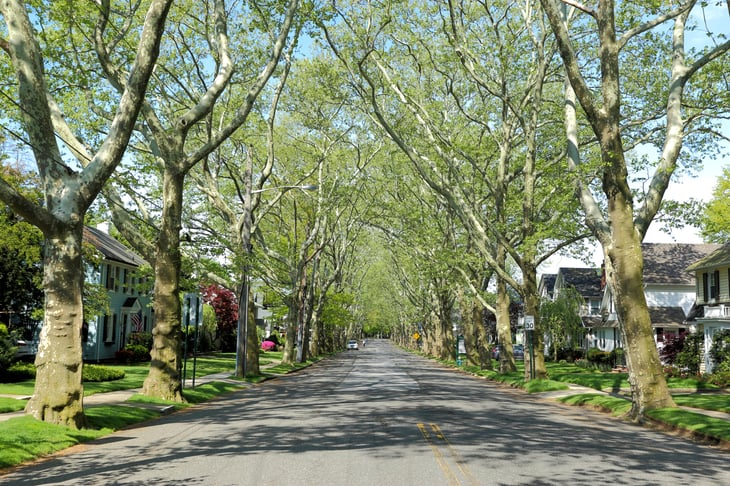
- Average value per unit authorized: $316,904
- Total value of units authorized: $432,573,679
- Total units authorized: 1,365
- Single-family units as a proportion of total: 55.2%
10. Palm Beach, FL

- Average value per unit authorized: $321,470
- Total value of units authorized: $2,523,859,005
- Total units authorized: 7,851
- Single-family units as a proportion of total: 53.6%
9. San Francisco, CA

- Average value per unit authorized: $325,290
- Total value of units authorized: $819,406,693
- Total units authorized: 2,519
- Single-family units as a proportion of total: 1.3%
8. Honolulu, HI

- Average value per unit authorized: $325,696
- Total value of units authorized: $468,350,350
- Total units authorized: 1,438
- Single-family units as a proportion of total: 65.2%

7. Wayne, MI
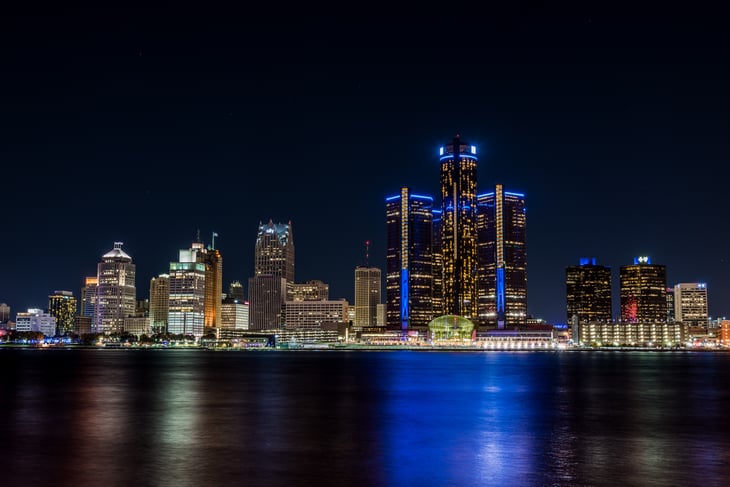
- Average value per unit authorized: $340,811
- Total value of units authorized: $763,416,226
- Total units authorized: 2,240
- Single-family units as a proportion of total: 49.1%
6. DuPage, IL

- Average value per unit authorized: $343,556
- Total value of units authorized: $533,886,282
- Total units authorized: 1,554
- Single-family units as a proportion of total: 62.1%
5. Cuyahoga, OH

- Average value per unit authorized: $356,725
- Total value of units authorized: $279,672,077
- Total units authorized: 784
- Single-family units as a proportion of total: 95.9%
4. San Mateo, CA
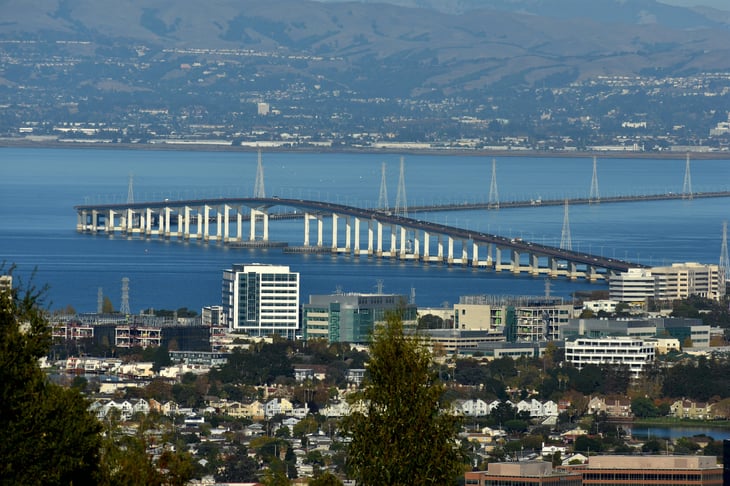
- Average value per unit authorized: $406,705
- Total value of units authorized: $771,112,297
- Total units authorized: 1,896
- Single-family units as a proportion of total: 28.2%
3. St. Louis, MO

- Average value per unit authorized: $416,004
- Total value of units authorized: $430,147,731
- Total units authorized: 1,034
- Single-family units as a proportion of total: 89.5%
2. Fairfield, CT
- Average value per unit authorized: $416,959
- Total value of units authorized: $538,711,638
- Total units authorized: 1,292
- Single-family units as a proportion of total: 55.3%
1. Suffolk, NY
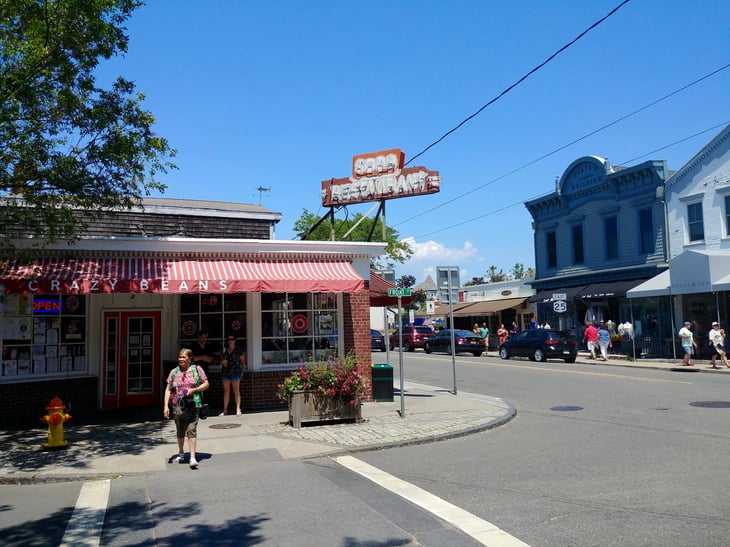
- Average value per unit authorized: $682,633
- Total value of units authorized: $995,961,917
- Total units authorized: 1,459
- Single-family units as a proportion of total: 86.2%
Methodology

The data used in this analysis is from the U.S. Census Bureau’s Building Permits Survey (2021), the most recent data available.
To determine the locations where the most expensive homes are being built, researchers at Construction Coverage calculated the average permit value per unit authorized. Authorized units included both single-unit and multiple-unit structures.
It’s important to note that the value of the building permit does not reflect the ultimate market value of the unit, but rather the total value of all construction work for which the permit is issued.
To improve relevance, only counties with at least 200,000 residents were included.
Add a Comment
Our Policy: We welcome relevant and respectful comments in order to foster healthy and informative discussions. All other comments may be removed. Comments with links are automatically held for moderation.