


This story originally appeared on CoPilot.
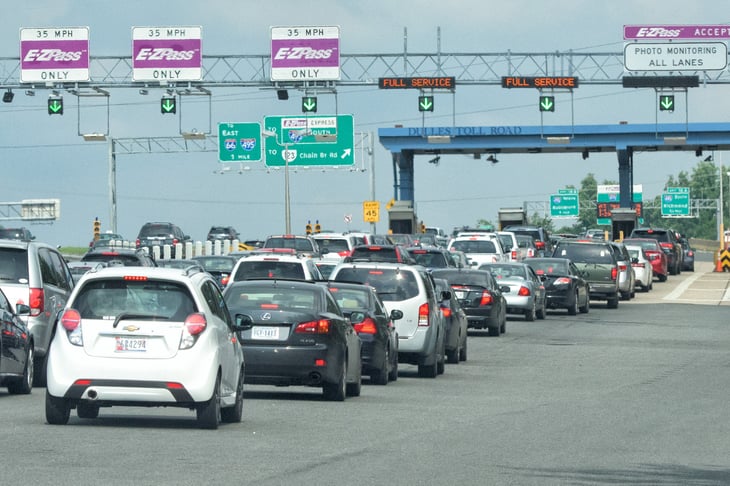
The American car culture is slowly shifting. Vehicle sales have been declining for years, and fewer workers are commuting by car. More recently, the onset of the COVID-19 pandemic caused auto sales to crash temporarily. But even as the industry has rebounded, the long-term effects on the auto industry remain uncertain. With millions of Americans working from home, fewer people are commuting, but fewer people also want to take public transportation. According to the most recent data from the U.S. Census Bureau, there are 0.85 passenger vehicles per person aged 16 and over (slightly less than one vehicle per person) in the U.S., but in certain car-dependent areas, this number remains higher.
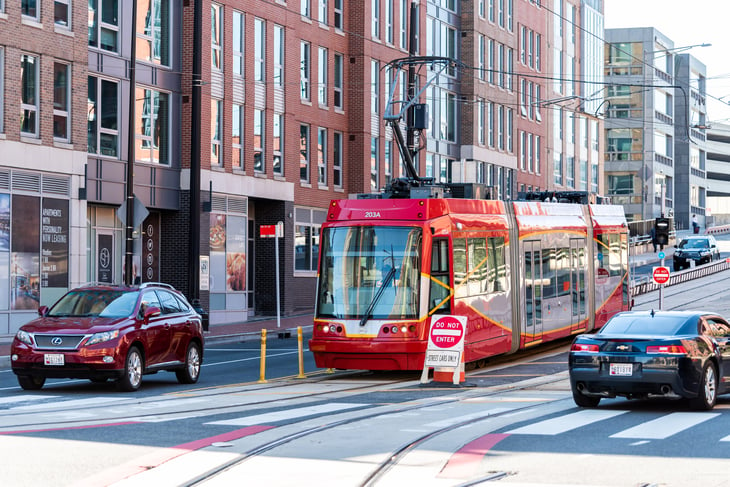
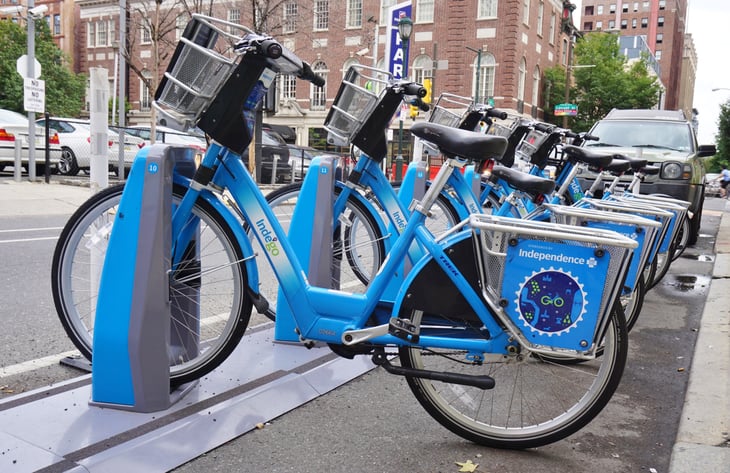
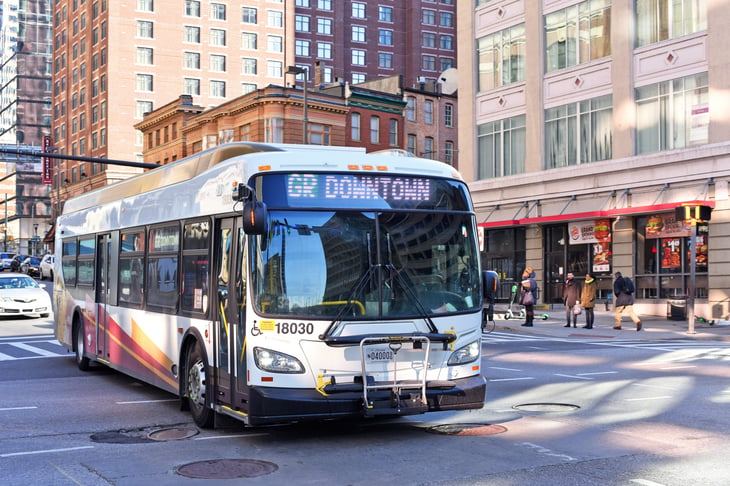
While the overwhelming majority of workers commute by car, the share of car commuters has fallen over the last decade to stand at 84.8 percent in 2019. Over the same time period, the share of workers who commute by other modes of transportation — including public transit, walking, and biking — has stayed relatively constant. However, the share of workers who work from home has increased, going from 4.3 percent in 2010 to 5.7 percent in 2019. This figure is likely to increase substantially in 2020 and 2021 as a result of the pandemic.
Alongside declining rates of car commuting, vehicle sales in the U.S. have also been trending downward since around 2016 as Americans drive less. Experts attribute the decline in driving to a variety of factors, including the fact that young people are delaying getting their driver’s licenses and using them less, the increase in working from home, and the rise in online shopping. Even after the pandemic is over, many Americans are likely to continue working from home at least part of the time, which will affect overall car usage and likely future vehicle sales.
Car dependency varies significantly across the U.S., depending on such factors as the availability of public transportation, the time it takes to commute by car, and the cost of car ownership. Due in large part to its substantial rural population and lack of public transit, the Great Plains states report more cars per capita than the rest of the country. Wyoming and North Dakota have the greatest number of vehicles per person, at 1.12 and 1.09, respectively. The states with the fewest vehicles per driving-age resident, New York (0.59) and Massachusetts (0.76), have large, dense urban populations and well-developed alternative modes of transportation.
Large Cities With the Most Cars

The nation’s large cities that have the most vehicles per person generally lack significant public transit alternatives to personal transportation. Residents of these less-densely populated cities, many in the more rural Great Plains region, tend to rely mostly on cars to get around.
1. Virginia Beach, VA
- Number of vehicles per person aged 16 and over: 0.95
- Aggregate number of vehicles: 343,525
- Population aged 16 years and over: 361,953
- Median household income: $79,054
- Percentage of workers who drive to work: 89.4%
- Mean commute time (hours per week): 4.0
2. Colorado Springs, CO

- Number of vehicles per person aged 16 and over: 0.93
- Aggregate number of vehicles: 357,136
- Population aged 16 years and over: 385,499
- Median household income: $70,527
- Percentage of workers who drive to work: 87.4%
- Mean commute time (hours per week): 3.9
3. Wichita, KS

- Number of vehicles per person aged 16 and over: 0.93
- Aggregate number of vehicles: 282,182
- Population aged 16 years and over: 302,645
- Median household income: $55,056
- Percentage of workers who drive to work: 93.7%
- Mean commute time (hours per week): 3.2

4. Albuquerque, NM
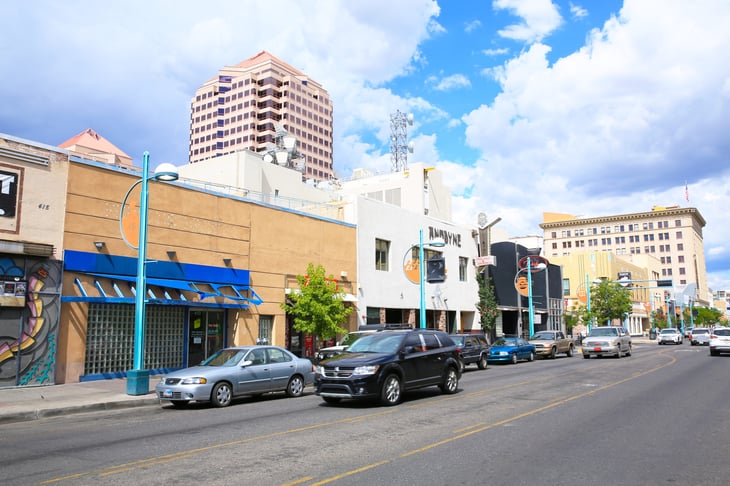
- Number of vehicles per person aged 16 and over: 0.88
- Aggregate number of vehicles: 396,380
- Population aged 16 years and over: 452,509
- Median household income: $55,567
- Percentage of workers who drive to work: 90.0%
- Mean commute time (hours per week): 3.8
5. Omaha, NE

- Number of vehicles per person aged 16 and over: 0.88
- Aggregate number of vehicles: 325,748
- Population aged 16 years and over: 369,885
- Median household income: $61,305
- Percentage of workers who drive to work: 90.1%
- Mean commute time (hours per week): 3.3
6. Tulsa, OK

- Number of vehicles per person aged 16 and over: 0.88
- Aggregate number of vehicles: 275,912
- Population aged 16 years and over: 312,854
- Median household income: $49,158
- Percentage of workers who drive to work: 91.0%
- Mean commute time (hours per week): 3.1
7. Nashville-Davidson, TN
- Number of vehicles per person aged 16 and over: 0.87
- Aggregate number of vehicles: 473,045
- Population aged 16 years and over: 543,328
- Median household income: $63,462
- Percentage of workers who drive to work: 84.5%
- Mean commute time (hours per week): 4.2
8. Oklahoma City, OK

- Number of vehicles per person aged 16 and over: 0.87
- Aggregate number of vehicles: 439,499
- Population aged 16 years and over: 507,535
- Median household income: $55,492
- Percentage of workers who drive to work: 92.4%
- Mean commute time (hours per week): 3.6
9. Kansas City, MO

- Number of vehicles per person aged 16 and over: 0.87
- Aggregate number of vehicles: 341,992
- Population aged 16 years and over: 394,104
- Median household income: $55,259
- Percentage of workers who drive to work: 88.8%
- Mean commute time (hours per week): 3.7
10. Aurora, CO

- Number of vehicles per person aged 16 and over: 0.87
- Aggregate number of vehicles: 255,744
- Population aged 16 years and over: 294,342
- Median household income: $69,235
- Percentage of workers who drive to work: 86.8%
- Mean commute time (hours per week): 5.1
Large Cities With the Fewest Cars
Not every city requires residents to be dependent on a car to get around. Public transportation options in the following cities contribute to them having the fewest cars per person.
1. New York, NY

- Number of vehicles per person aged 16 and over: 0.29
- Aggregate number of vehicles: 1,991,096
- Population aged 16 years and over: 6,803,099
- Median household income: $69,407
- Percentage of workers who drive to work: 26.2%
- Mean commute time (hours per week): 6.9
2. Boston, MA

- Number of vehicles per person aged 16 and over: 0.43
- Aggregate number of vehicles: 259,169
- Population aged 16 years and over: 598,649
- Median household income: $79,018
- Percentage of workers who drive to work: 42.8%
- Mean commute time (hours per week): 5.2
3. Washington, D.C.
- Number of vehicles per person aged 16 and over: 0.44
- Aggregate number of vehicles: 260,225
- Population aged 16 years and over: 587,819
- Median household income: $92,266
- Percentage of workers who drive to work: 38.5%
- Mean commute time (hours per week): 5.3
4. San Francisco, CA
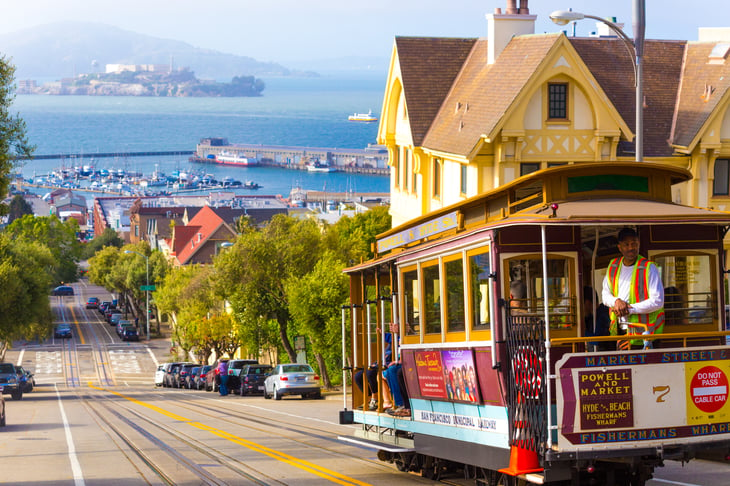
- Number of vehicles per person aged 16 and over: 0.49
- Aggregate number of vehicles: 379,064
- Population aged 16 years and over: 774,619
- Median household income: $123,859
- Percentage of workers who drive to work: 35.0%
- Mean commute time (hours per week): 5.8

5. Philadelphia, PA
- Number of vehicles per person aged 16 and over: 0.51
- Aggregate number of vehicles: 646,438
- Population aged 16 years and over: 1,275,366
- Median household income: $47,474
- Percentage of workers who drive to work: 56.6%
- Mean commute time (hours per week): 5.7
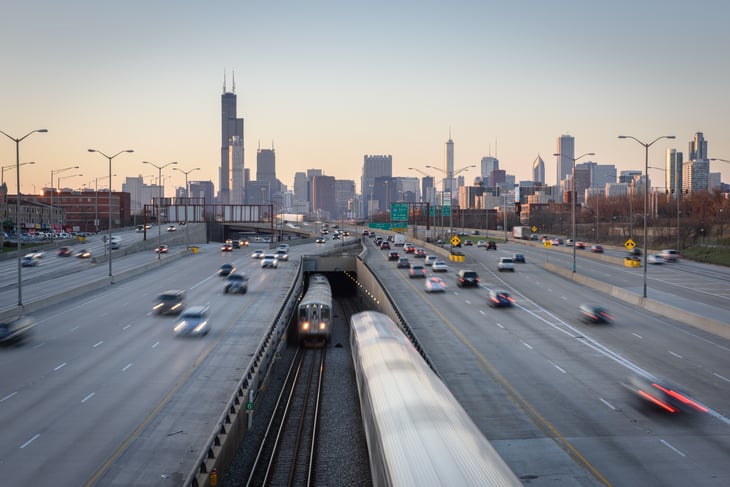
6. Chicago, IL

- Number of vehicles per person aged 16 and over: 0.54
- Aggregate number of vehicles: 1,180,685
- Population aged 16 years and over: 2,197,345
- Median household income: $61,811
- Percentage of workers who drive to work: 55.4%
- Mean commute time (hours per week): 5.9
7. Baltimore, MD
- Number of vehicles per person aged 16 and over: 0.56
- Aggregate number of vehicles: 272,122
- Population aged 16 years and over: 485,560
- Median household income: $50,177
- Percentage of workers who drive to work: 70.6%
- Mean commute time (hours per week): 5.3
8. Miami, FL

- Number of vehicles per person aged 16 and over: 0.61
- Aggregate number of vehicles: 242,470
- Population aged 16 years and over: 395,648
- Median household income: $42,966
- Percentage of workers who drive to work: 76.2%
- Mean commute time (hours per week): 4.7
9. Detroit, MI

- Number of vehicles per person aged 16 and over: 0.61
- Aggregate number of vehicles: 318,177
- Population aged 16 years and over: 520,143
- Median household income: $33,965
- Percentage of workers who drive to work: 82.6%
- Mean commute time (hours per week): 4.2
10. New Orleans, LA

- Number of vehicles per person aged 16 and over: 0.62
- Aggregate number of vehicles: 199,601
- Population aged 16 years and over: 320,571
- Median household income: $45,615
- Percentage of workers who drive to work: 77.1%
- Mean commute time (hours per week): 3.9
Detailed Findings & Methodology
To determine the cities with the most and fewest cars, researchers analyzed the latest data from the U.S. Census Bureau’s 2019 American Community Survey. Cities were ranked according to the number of vehicles per person aged 16 and over. In the event of a tie, the city with the greater aggregate number of vehicles was ranked higher. Researchers also calculated the population aged 16 years and over, median household income, the percentage of workers who drive to work, and the mean commute time.
To improve relevance, only cities with at least 100,000 people were included in the analysis. Additionally, cities were grouped into the following cohorts based on population size:
- Small cities: 100,000–149,999
- Midsize cities: 150,000–349,999
- Large cities: 350,000 or more
The large cities with the greatest number of vehicles per person are locales without well-developed public transit systems. These cities are not as densely populated as some other large cities, and people tend to rely mostly on cars to get around. A very high share of workers in these cities commute by car—89.4 percent on average, compared with 84.8 percent for the U.S. overall. Median household income tends to be lower in these cities than the national median, reflecting the lower cost of living, and commute times are mostly lower than the national average. While people in these cities are highly dependent on cars, they have the benefit of shorter commutes.
The large cities with the fewest cars tend to have densely populated urban cores with a range of alternative transportation options. Commuting by car is far less common, but commutes are longer. Median household income varies widely across these cities.
Like the large city group, the small and midsize cities with the most and fewest cars follow similar trends. Car-dependent locations tend to be located in largely rural states without much in the way of public transportation, while those with fewer cars per capita are generally suburbs of large cities where public transportation options are still widely available.
Add a Comment
Our Policy: We welcome relevant and respectful comments in order to foster healthy and informative discussions. All other comments may be removed. Comments with links are automatically held for moderation.