


Editor's Note: This story originally appeared on LawnStarter.
With summers getting hotter than ever, there’s no better time to have an in-ground swimming pool in your backyard to help you cool off.
That’s not ideal — or even possible — in some parts of the U.S., though.
To find the most “pool-ready” cities in America, LawnStarter ranked 2022’s best cities to own a swimming pool. We compared nearly 200 of the biggest U.S. cities based on climate, yard size, access to pool installation and maintenance, as well as costs.
We also looked at the share of homes with pools in each real estate market to gauge how well the city embraces pool culture.
Dive into our ranking below.
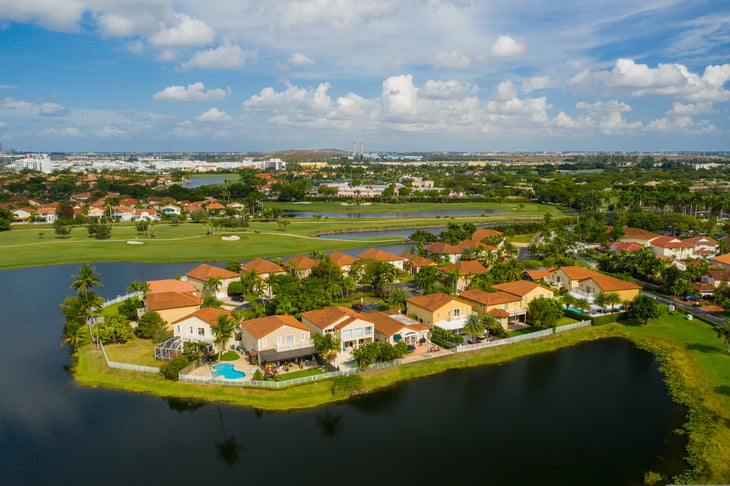
1. Fort Lauderdale, FL
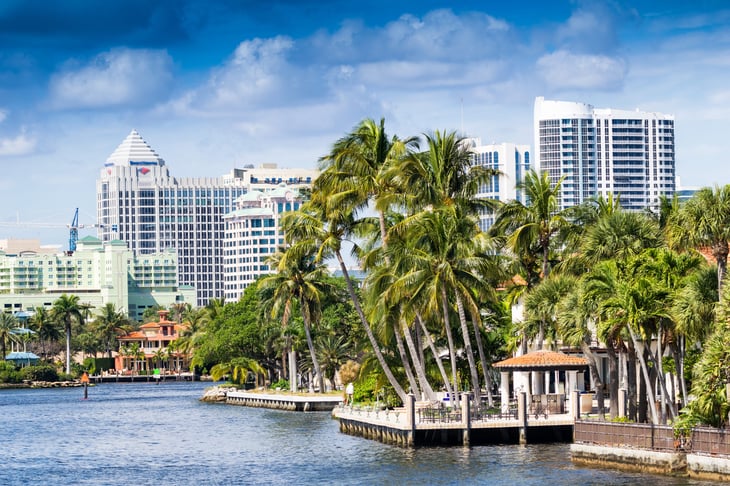
Overall score: 65.32
Pool-readiness rank: 4
Installation rank: 16
Maintenance rank: 50
Climate rank: 6
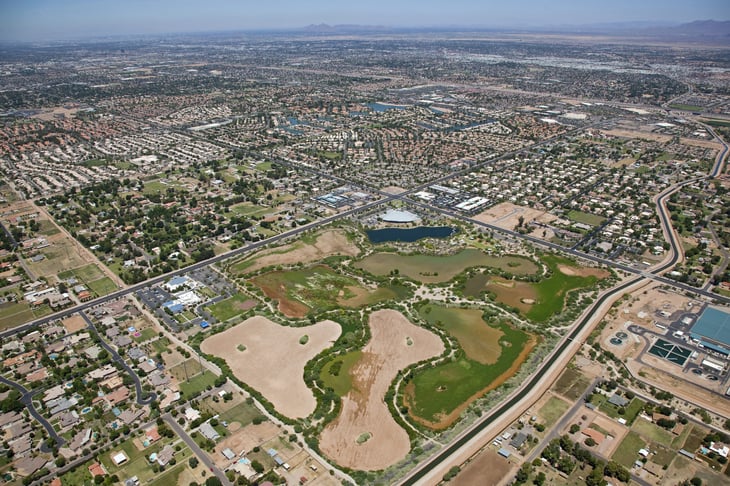
2. Scottsdale, AZ
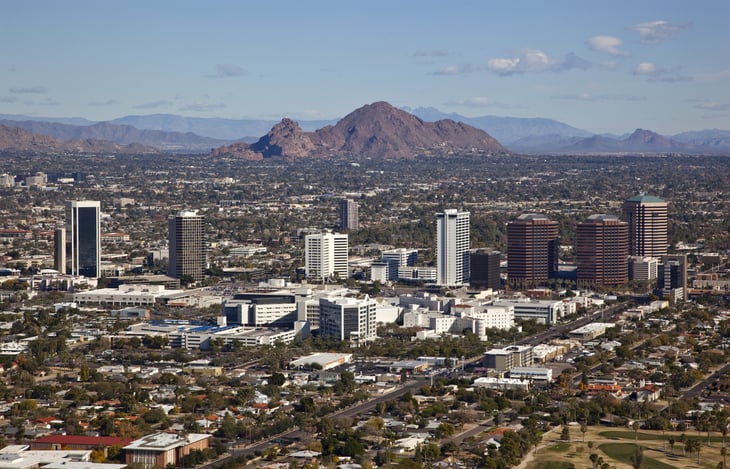
Overall score: 63.91
Pool-readiness rank: 1
Installation rank: 27
Maintenance rank: 5
Climate rank: 87
3. Cape Coral, FL
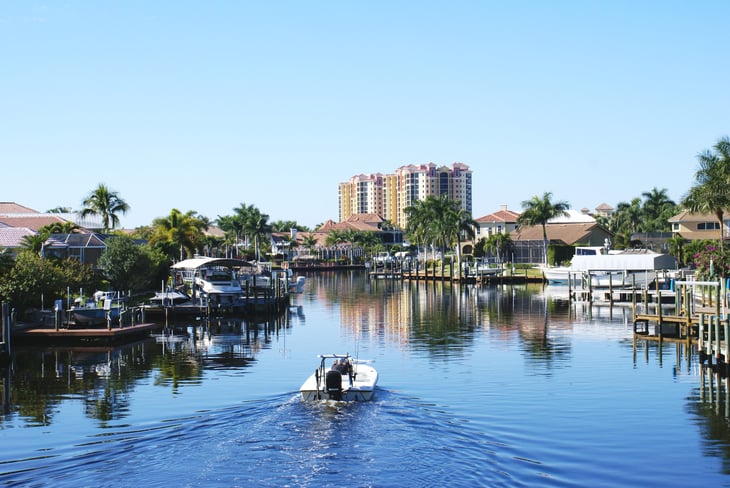
Overall score: 62.60
Pool-readiness rank: 3
Installation rank: 59
Maintenance rank: 44
Climate rank: 1
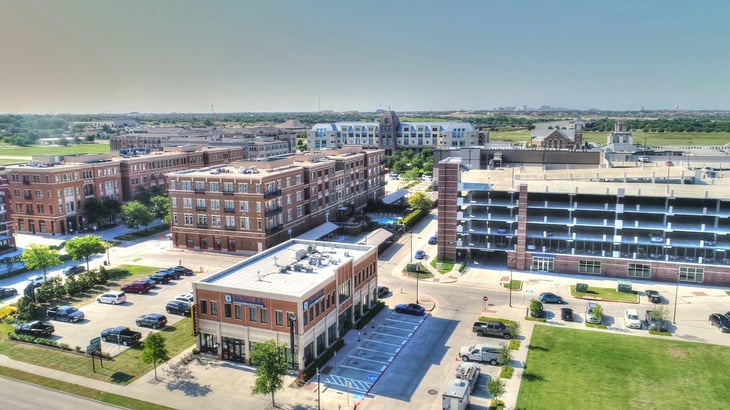
4. Plano, TX
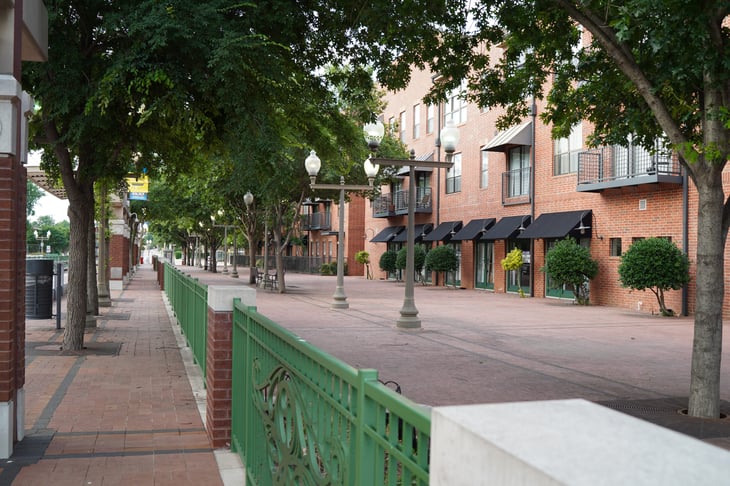
Overall score: 62.31
Pool-readiness rank: 27
Installation rank: 32
Maintenance rank: 15
Climate rank: 13
5. Frisco, TX
Overall score: 62.23
Pool-readiness rank: 68
Installation rank: 22
Maintenance rank: 14
Climate rank: 13
6. McKinney, TX
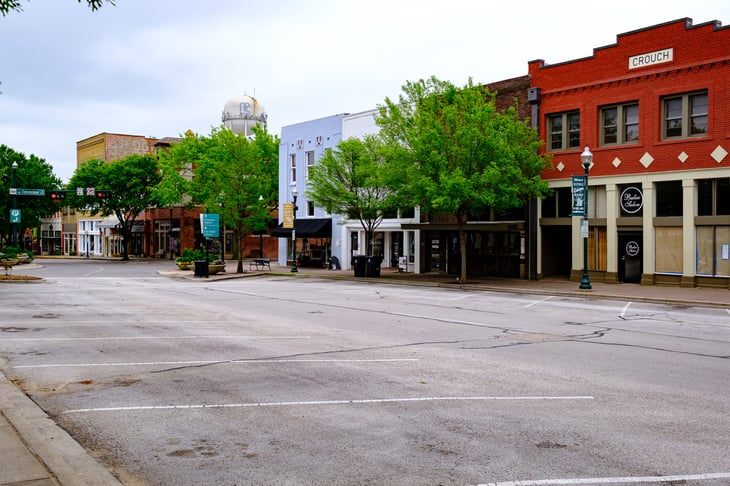
Overall score: 62.21
Pool-readiness rank: 18
Installation rank: 35
Maintenance rank: 21
Climate rank: 10
7. Austin, TX

Overall score: 60.50
Pool-readiness rank: 66
Installation rank: 57
Maintenance rank: 8
Climate rank: 5
8. Cary, NC
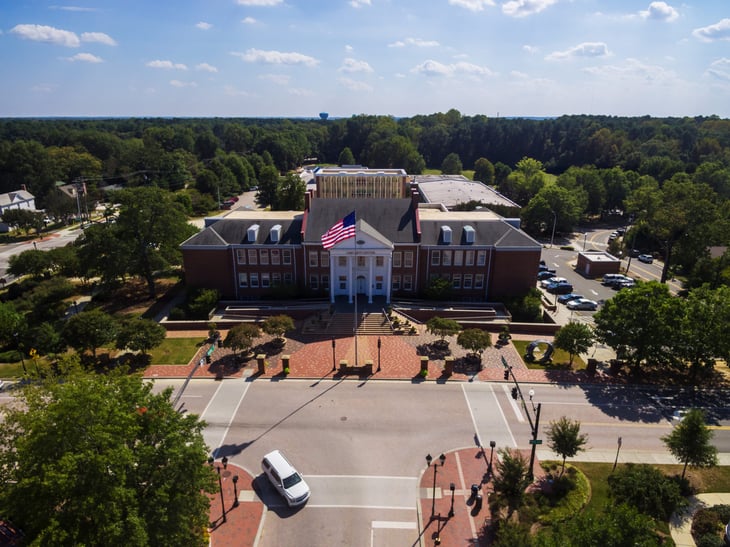
Overall score: 59.14
Pool-readiness rank: 29
Installation rank: 38
Maintenance rank: 20
Climate rank: 30
9. Hollywood, FL
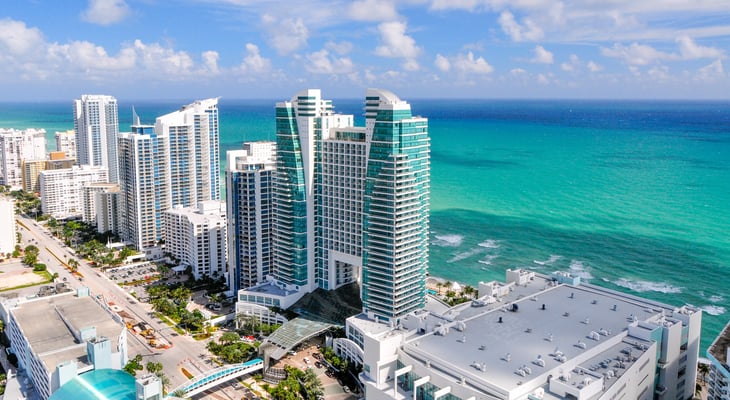
Overall score: 58.81
Pool-readiness rank: 31
Installation rank: 26
Maintenance rank: 147
Climate rank: 6

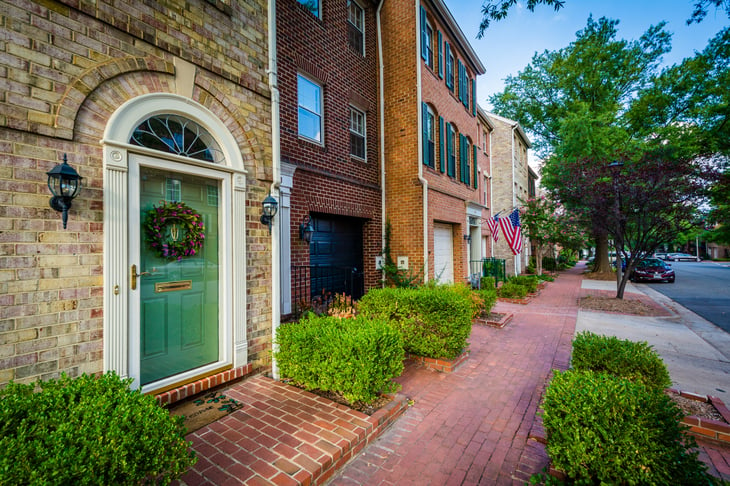
10. Alexandria, VA
Overall score: 58.28
Pool-readiness rank: 143
Installation rank: 10
Maintenance rank: 60
Climate rank: 40
11. Pembroke Pines, FL
Overall score: 58.14
Pool-readiness rank: 82
Installation rank: 24
Maintenance rank: 116
Climate rank: 6
12. Gilbert, AZ
Overall score: 56.46
Pool-readiness rank: 20
Installation rank: 36
Maintenance rank: 6
Climate rank: 87
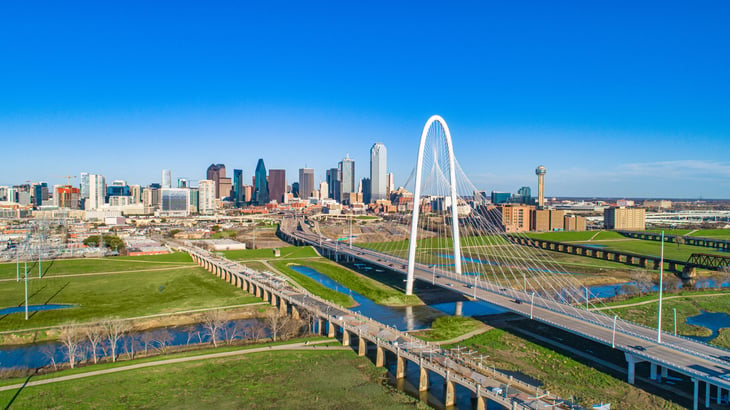
13. Dallas, TX
Overall score: 56.35
Pool-readiness rank: 84
Installation rank: 79
Maintenance rank: 23
Climate rank: 11
14. Arlington, VA

Overall score: 56.05
Pool-readiness rank: 165
Installation rank: 20
Maintenance rank: 39
Climate rank: 35
15. Tallahassee, FL
Overall score: 56.01
Pool-readiness rank: 9
Installation rank: 97
Maintenance rank: 130
Climate rank: 16
Methodology

For each of the 200 biggest U.S. cities, we first gathered publicly available data on the factors listed below.
We then grouped those factors into four categories: Pool-Readiness, Installation, Maintenance, and Climate.
Next, we calculated weighted scores for each city in each category.
Finally, we averaged the scores for each city across all categories. We eliminated six cities lacking sufficient data in a single category, resulting in a total sample size of 194 cities.
The city that earned the highest average score is considered “Best” (No. 1), while the city with the lowest is “Worst” (No. 194).
These are the factors we considered:
- Average Yard Square Footage
- Share of Homes with Pools on the Market
- Pool Installers within 10 Miles (per Number of Single-Family Detached Homes)
- Average Minimum Pool Installation Cost (as % of Average Annual Household Income)
- Number of Pool Cleaners
- Average Per-Visit Pool Cleaning Cost (as % of Average Weekly Household Income)
- Historical Average Number of Extremely Hot Days
- Historical Average Number of Extremely Cold Days
- Historical Average Monthly Percentage of Sunshine
- Drought Risk Score
- Heatwave Risk Score
- Natural Hazards Index
- Forced Water Cuts Due to Drought
Add a Comment
Our Policy: We welcome relevant and respectful comments in order to foster healthy and informative discussions. All other comments may be removed. Comments with links are automatically held for moderation.