
Editor's Note: This story originally appeared on LawnStarter.
Which cities are best for running a short-term rental property on sites like Airbnb and Vrbo?
LawnStarter ranked 2023’s Best Cities to Own a Vacation Rental, with major changes in this year’s ranking due to the widespread “Airbnbust.”
Hint: College towns and smaller cities are your best bets now. Big cities dropped in our rankings this year.
We compared over 180 of the biggest U.S. cities based on six categories.
We considered legal restrictions on short-term rentals, occupancy rates, and revenue potential. We also looked at operating expenses like housekeeping services and utilities, among 18 total metrics.
Find the best spot for your future BnB in our ranking below. To learn how we ranked the cities, see our methodology at the end.
1. Durham, NC

- Overall Score: 70.99
- Legality Rank: 1
- Revenue Potential Rank: 21
- Initial Investment Rank: 96
- Operating Expenses Rank: 23
- Entertainment Options Rank: 95
- Guest Safety Rank: 71
2. Birmingham, AL

- Overall Score: 70.32
- Legality Rank: 1
- Revenue Potential Rank: 72
- Initial Investment Rank: 30
- Operating Expenses Rank: 4
- Entertainment Options Rank: 71
- Guest Safety Rank: 142
3. Milwaukee, WI

- Overall Score: 70.21
- Legality Rank: 1
- Revenue Potential Rank: 41
- Initial Investment Rank: 37
- Operating Expenses Rank: 59
- Entertainment Options Rank: 43
- Guest Safety Rank: 84
4. Mobile, AL
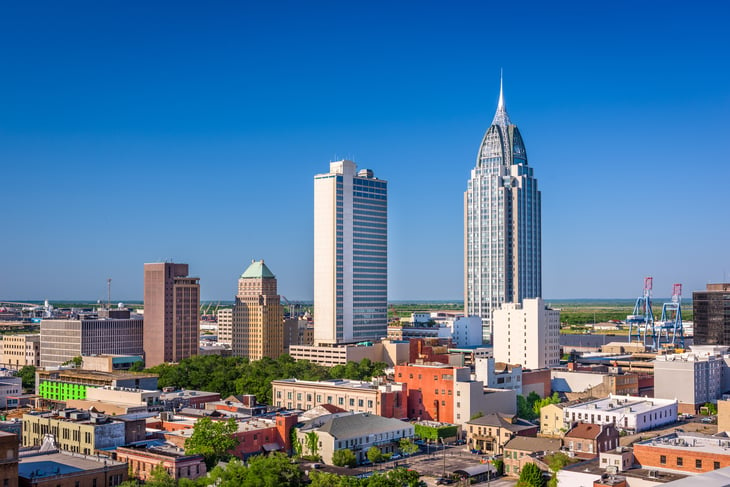
- Overall Score: 69.61
- Legality Rank: 1
- Revenue Potential Rank: 82
- Initial Investment Rank: 8
- Operating Expenses Rank: 9
- Entertainment Options Rank: 102
- Guest Safety Rank: 179
5. Anchorage, AK
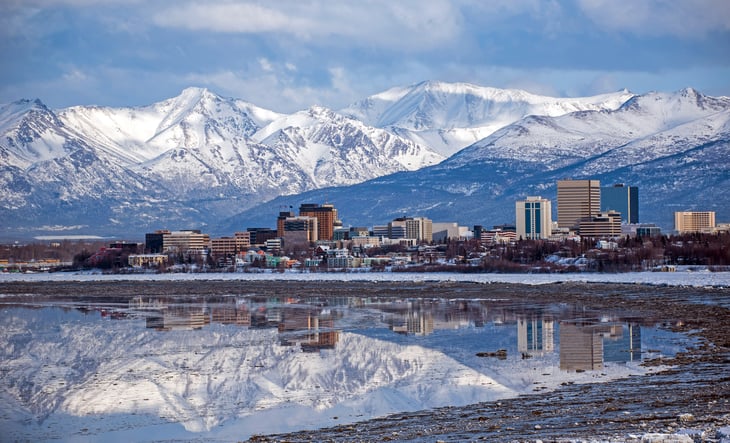
- Overall Score: 68.81
- Legality Rank: 1
- Revenue Potential Rank: 28
- Initial Investment Rank: 78
- Operating Expenses Rank: 93
- Entertainment Options Rank: 37
- Guest Safety Rank: 147
6. Winston-Salem, NC

- Overall Score: 68.21
- Legality Rank: 1
- Revenue Potential Rank: 91
- Initial Investment Rank: 27
- Operating Expenses Rank: 37
- Entertainment Options Rank: 87
- Guest Safety Rank: 65
7. Indianapolis, IN

- Overall Score: 67.30
- Legality Rank: 32
- Revenue Potential Rank: 47
- Initial Investment Rank: 20
- Operating Expenses Rank: 11
- Entertainment Options Rank: 39
- Guest Safety Rank: 128
8. Rochester, NY

- Overall Score: 67.08
- Legality Rank: 1
- Revenue Potential Rank: 104
- Initial Investment Rank: 9
- Operating Expenses Rank: 92
- Entertainment Options Rank: 62
- Guest Safety Rank: 27
9. Mesa, AZ

- Overall Score: 67.07
- Legality Rank: 1
- Revenue Potential Rank: 80
- Initial Investment Rank: 120
- Operating Expenses Rank: 20
- Entertainment Options Rank: 85
- Guest Safety Rank: 70
10. Charlotte, NC

- Overall Score: 67.06
- Legality Rank: 32
- Revenue Potential Rank: 29
- Initial Investment Rank: 77
- Operating Expenses Rank: 26
- Entertainment Options Rank: 31
- Guest Safety Rank: 109
11. Cleveland, OH

- Overall Score: 67.01
- Legality Rank: 32
- Revenue Potential Rank: 51
- Initial Investment Rank: 15
- Operating Expenses Rank: 19
- Entertainment Options Rank: 48
- Guest Safety Rank: 129
12. Syracuse, NY

- Overall Score: 66.50
- Legality Rank: 1
- Revenue Potential Rank: 118
- Initial Investment Rank: 10
- Operating Expenses Rank: 87
- Entertainment Options Rank: 113
- Guest Safety Rank: 30
13. Tempe, AZ

- Overall Score: 66.45
- Legality Rank: 32
- Revenue Potential Rank: 17
- Initial Investment Rank: 120
- Operating Expenses Rank: 5
- Entertainment Options Rank: 96
- Guest Safety Rank: 168
14. Phoenix, AZ

- Overall Score: 66.45
- Legality Rank: 32
- Revenue Potential Rank: 30
- Initial Investment Rank: 120
- Operating Expenses Rank: 7
- Entertainment Options Rank: 28
- Guest Safety Rank: 156
15. Cincinnati, OH

- Overall Score: 66.34
- Legality Rank: 32
- Revenue Potential Rank: 53
- Initial Investment Rank: 26
- Operating Expenses Rank: 31
- Entertainment Options Rank: 41
- Guest Safety Rank: 119
Methodology

First, we determined the factors (metrics) that are most relevant to rank the Best Cities to Own a Vacation Rental. We then assigned a weight to each factor based on its importance and grouped those factors into six categories: Legality, Revenue Potential, Initial Investment, Operating Expenses, Entertainment Options, and Guest Safety. The factors are listed below.
For each of the 200 biggest U.S. cities, we then gathered data on each factor from the sources listed below the table. We eliminated 18 cities lacking sufficient data in a single category, resulting in a final sample size of 182 cities.
Finally, we calculated scores (out of 100 points) for each city to determine its rank in each factor, each category, and overall. A city’s Overall Score is the average of its scores across all factors and categories. The highest Overall Score ranked “Best” (No. 1).
Notes:
- The “Revenue Potential” data is based on listings for 1 bedroom, 1 bathroom, and 2 guests.
- “Number of Attractions” includes categories like cultural tours, museums and galleries, landmarks, nightlife options, parks, and live performances.
- While this study reflects the most recent data from our sources at the time of writing, always check local ordinances before investing in or listing a short-term rental property.
Metrics:
- Short-Term/Airbnb Rental for Non-Owner-Occupied Property Allowed
- Rental Period Limited
- Number of Guests Limited
- Short-Term Rental Permit Fee Imposed
- Occupancy Rate in Past 12 Months
- Average Daily Short-Term Rental Rate in Past 12 Months
- Average Revenue in Past 12 Months
- Median Listing Price per Square Foot
- 1-Year Change in Median Listing Price per Square Foot
- Median Annual Property Tax (as % of Median House Price)
- Cost of Living Index
- Average Cost of Housekeeping Services (as % of Average Revenue)
- Average Cost of Lawn and Garden Services (as % of Average Revenue)
- Average Cost of Home Improvements (as % of Average Revenue)
- Average Cost of Utilities, Fuel, and Public Services (as % of Average Revenue)
- Number of Attractions
- Crime Index
- Natural Hazards Index


Add a Comment
Our Policy: We welcome relevant and respectful comments in order to foster healthy and informative discussions. All other comments may be removed. Comments with links are automatically held for moderation.