


Editor's Note: This story originally appeared on Construction Coverage.
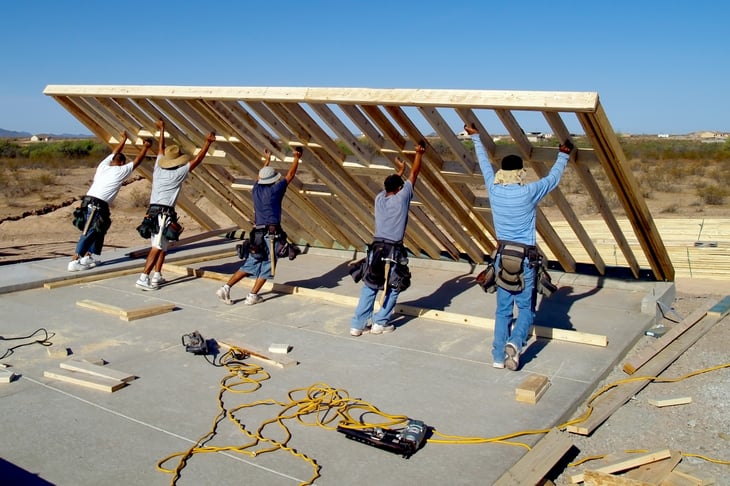
The lack of housing supply has been exacerbated by significant underinvestment in new housing since the Great Recession. And despite a clear need for new housing supply, the construction industry struggled to keep up during the COVID-19 pandemic.
Pandemic-related disruptions produced worker shortages and hindered supply chains, making it harder and more expensive to obtain building materials. As a result, more single-family units saw months-long delays in the time it takes to start and complete construction when compared with years past.
The effects of these disruptions continue to linger in the residential housing industry.
Although supply is a challenge across the U.S., some locations are moving faster than others in authorizing new construction.
To determine the metros building the most homes, researchers at Construction Coverage analyzed the latest data from the U.S. Census Bureau and Zillow. See their methodology at the end.
Here are the U.S. metropolitan areas building the most homes.
15. Denver-Aurora-Lakewood, CO

- New housing units authorized per 1,000 existing homes (2022): 18.5
- New housing units authorized per 1,000 existing homes (2020): 16.2
- Total new housing units authorized (2022): 23,476
- Total new housing units authorized (2020): 19,732
- Percentage change in housing units authorized (2020-2022): +19.0%
- Median home price: $584,714
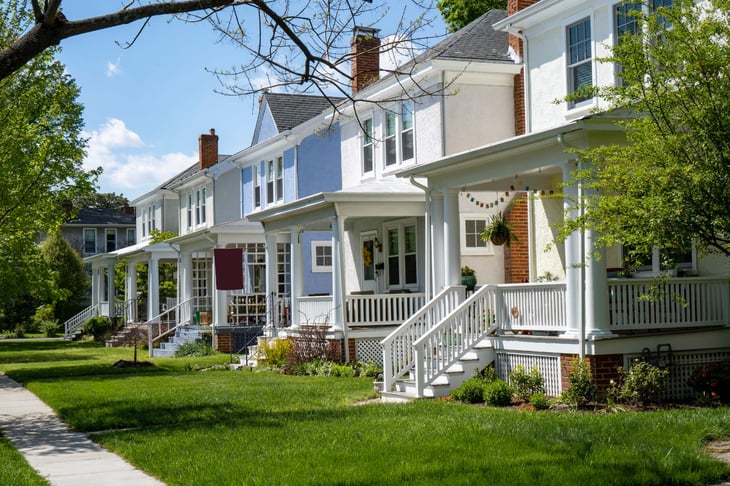
14. Richmond, VA
- New housing units authorized per 1,000 existing homes (2022): 18.6
- New housing units authorized per 1,000 existing homes (2020): 15.4
- Total new housing units authorized (2022): 10,414
- Total new housing units authorized (2020): 8,190
- Percentage change in housing units authorized (2020-2022): +27.2%
- Median home price: $352,581
13. Atlanta-Sandy Springs-Alpharetta, GA
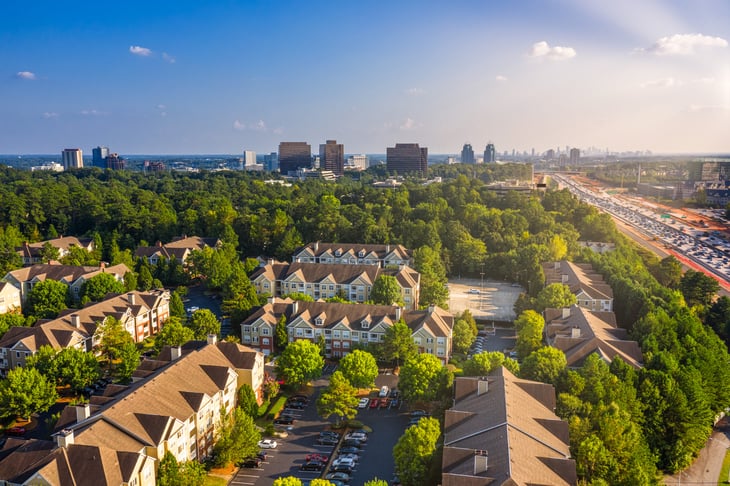
- New housing units authorized per 1,000 existing homes (2022): 19.6
- New housing units authorized per 1,000 existing homes (2020): 13.7
- Total new housing units authorized (2022): 48,107
- Total new housing units authorized (2020): 32,346
- Percentage change in housing units authorized (2020-2022): +48.7%
- Median home price: $374,047

12. Tampa-St. Petersburg-Clearwater, FL
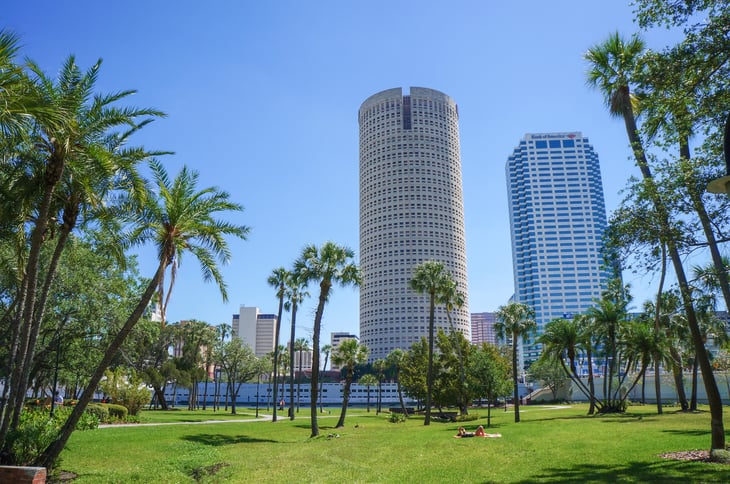
- New housing units authorized per 1,000 existing homes (2022): 20.1
- New housing units authorized per 1,000 existing homes (2020): 14.0
- Total new housing units authorized (2022): 29,969
- Total new housing units authorized (2020): 20,348
- Percentage change in housing units authorized (2020-2022): +47.3%
- Median home price: $375,313
11. Salt Lake City, UT
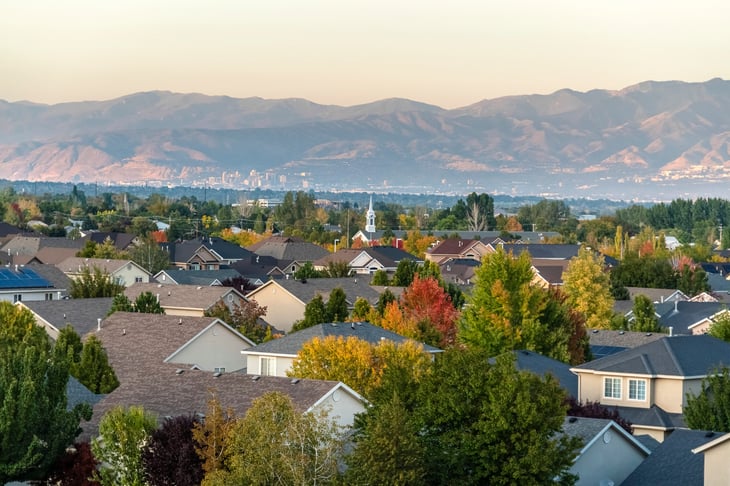
- New housing units authorized per 1,000 existing homes (2022): 21.7
- New housing units authorized per 1,000 existing homes (2020): 25.4
- Total new housing units authorized (2022): 10,102
- Total new housing units authorized (2020): 11,033
- Percentage change in housing units authorized (2020-2022): -8.4%
- Median home price: $533,606
10. Phoenix-Mesa-Chandler, AZ
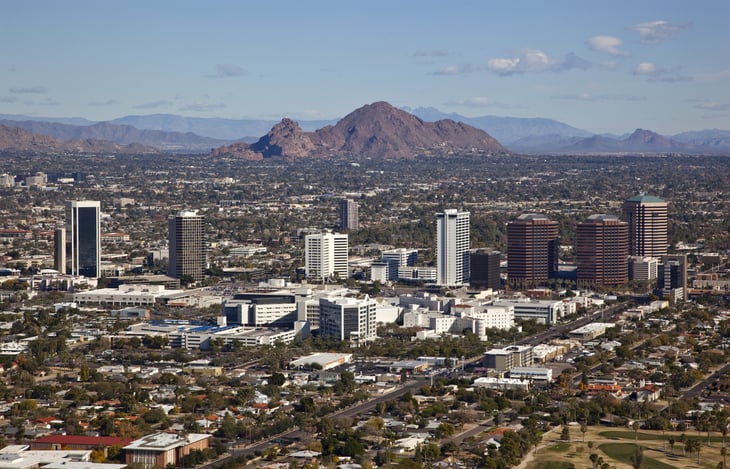
- New housing units authorized per 1,000 existing homes (2022): 23.3
- New housing units authorized per 1,000 existing homes (2020): 24.5
- Total new housing units authorized (2022): 47,267
- Total new housing units authorized (2020): 48,219
- Percentage change in housing units authorized (2020-2022): -2.0%
- Median home price: $446,110
9. San Antonio-New Braunfels, TX

- New housing units authorized per 1,000 existing homes (2022): 23.5
- New housing units authorized per 1,000 existing homes (2020): 18.3
- Total new housing units authorized (2022): 24,339
- Total new housing units authorized (2020): 16,697
- Percentage change in housing units authorized (2020-2022): +45.8%
- Median home price: $294,967
8. Charlotte-Concord-Gastonia, NC-SC
- New housing units authorized per 1,000 existing homes (2022): 23.9
- New housing units authorized per 1,000 existing homes (2020): 24.5
- Total new housing units authorized (2022): 27,212
- Total new housing units authorized (2020): 26,548
- Percentage change in housing units authorized (2020-2022): +2.5%
- Median home price: $369,590
7. Orlando-Kissimmee-Sanford, FL
- New housing units authorized per 1,000 existing homes (2022): 25.7
- New housing units authorized per 1,000 existing homes (2020): 22.7
- Total new housing units authorized (2022): 28,683
- Total new housing units authorized (2020): 24,499
- Percentage change in housing units authorized (2020-2022): +17.1%
- Median home price: $388,191
6. Dallas-Fort Worth-Arlington, TX

- New housing units authorized per 1,000 existing homes (2022): 25.8
- New housing units authorized per 1,000 existing homes (2020): 21.1
- Total new housing units authorized (2022): 77,894
- Total new housing units authorized (2020): 60,812
- Percentage change in housing units authorized (2020-2022): +28.1%
- Median home price: $376,026
5. Houston-The Woodlands-Sugar Land, TX
- New housing units authorized per 1,000 existing homes (2022): 26.8
- New housing units authorized per 1,000 existing homes (2020): 26.2
- Total new housing units authorized (2022): 75,728
- Total new housing units authorized (2020): 70,540
- Percentage change in housing units authorized (2020-2022): +7.4%
- Median home price: $306,423
4. Jacksonville, FL
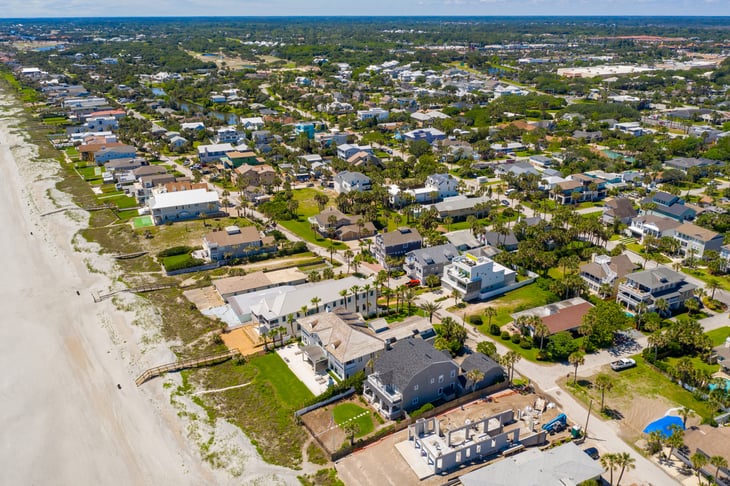
- New housing units authorized per 1,000 existing homes (2022): 32.6
- New housing units authorized per 1,000 existing homes (2020): 25.8
- Total new housing units authorized (2022): 23,169
- Total new housing units authorized (2020): 17,246
- Percentage change in housing units authorized (2020-2022): +34.3%
- Median home price: $355,024
3. Nashville-Davidson–Murfreesboro–Franklin, TN
- New housing units authorized per 1,000 existing homes (2022): 32.8
- New housing units authorized per vexisting homes (2020): 33.7
- Total new housing units authorized (2022): 28,192
- Total new housing units authorized (2020): 27,158
- Percentage change in housing units authorized (2020-2022): +3.8%
- Median home price: $436,866
2. Raleigh-Cary, NC

- New housing units authorized per 1,000 existing homes (2022): 36.2
- New housing units authorized per 1,000 existing homes (2020): 30.1
- Total new housing units authorized (2022): 21,568
- Total new housing units authorized (2020): 16,958
- Percentage change in housing units authorized (2020-2022): +27.2%
- Median home price: $433,469
1. Austin-Round Rock-Georgetown, TX

- New housing units authorized per 1,000 existing homes (2022): 42.5
- New housing units authorized per 1,000 existing homes (2020): 47.9
- Total new housing units authorized (2022): 42,364
- Total new housing units authorized (2020): 42,264
- Percentage change in housing units authorized (20202022): +0.2%
- Median home price: $487,537
Methodology

To determine the metros building the most homes, researchers at Construction Coverage analyzed the latest data from the U.S. Census Bureau’s “Building Permit Survey” and Zillow’s “Zillow Home Value Index (ZHVI).”
The researchers ranked metro areas according to the number of new housing units authorized per 1,000 existing homes in 2022. In the event of a tie, the metro with higher total new housing units authorized in 2022 was ranked higher.
Researchers also calculated the number of new housing units authorized per 1,000 existing homes in 2020, the total new housing units authorized in 2020, the percentage change in housing units authorized from 2020 to 2022, and the current median home price.
Only metropolitan areas with available data and with at least 100,000 people were included in the analysis.
Add a Comment
Our Policy: We welcome relevant and respectful comments in order to foster healthy and informative discussions. All other comments may be removed. Comments with links are automatically held for moderation.